Where might the "end signal" of this round of gold bull market quietly emerge?
2025-10-09 20:05:48
The gold bull market, which began at the end of 2022, has seen a cumulative increase of over 80%, pushing the spot price from approximately $1,800 per ounce to its current all-time high of approximately $4,060 per ounce. This upward trend is not simply driven by market speculation, but rather by the structural need to restructure global reserves. Central banks continue to increase their gold holdings, which has become a core support tool as a hedge against the risk of dollar dominance and a tool for diversifying reserves. According to data from the World Gold Council, global central banks' net purchases exceeded 500 tons in the first half of 2025, far exceeding pre-pandemic levels, pushing prices to accelerate through the $4,000 mark in a low-yield environment. However, like any cyclical asset, gold's appeal stems from its interest-free safe-haven properties. If the macroeconomic environment reverses, the momentum of this bull market will gradually fade.
What are the potential triggers for the end of gold's current bull market? This article will focus on potential triggers, analyzing key factors such as the global economic recovery, rising bond yields, and central bank asset allocation adjustments, and explore the transition path from the bull market's peak to high-level fluctuations.
The core drivers of this bull market lie in the dual forces of "low yields and high uncertainty." Since 2024, the Federal Reserve has cut interest rates by 150 basis points, pushing the 10-year Treasury yield to a low of approximately 3.6%, reducing the opportunity cost of gold to a historic low. Furthermore, geopolitical uncertainties—including the Russia-Ukraine situation and tensions in the Middle East—combined with risk aversion fueled by tariff talk have further fueled demand. Central bank gold purchases are particularly crucial, with emerging market institutions increasing their gold reserves from a historic low to over 12%, viewing it as a strategic asset to support currency stability. This "de-dollarization" process, while slow, provides a solid floor for prices. However, historical evidence shows that gold bull markets often enter a consolidation phase after reversal signals emerge: Following the collapse of the Bretton Woods system in 1971, gold prices soared to a peak of $850 per ounce in 1980, only to halve by more than 50% during the economic recovery. The current cycle is similarly poised to see prices fall 10-20% from current highs once the trigger is activated, marking the end of the "main phase" of the cycle.
An improving global economy is the classic catalyst for the end of a bull market. By boosting risk appetite, it directly erodes gold's safe-haven premium. If the Federal Reserve's stimulus policies in 2026—including potential fiscal expansion—take effect as expected, US GDP growth could exceed the current forecast range of 2.5-3%. This would cause global capital to shift from safe-haven assets to higher-yield opportunities such as stocks and industrial metals. This would reshape the structure of gold demand: investors would shift to an "opportunity cost" model, ETF inflows would reverse, and central bank gold purchases could slow.
Reputable analysts indicate that if the US rolls out a large-scale infrastructure or consumer stimulus bill in the first half of 2026, driving a rebound in employment and investment, gold prices will face significant downward pressure. Funds will shift to cyclical commodities like copper and aluminum, which are more resilient during economic expansions, while gold's relative appeal as a non-productive asset will decline. Historical parallels are striking: after the 1980 gold peak, the US economy was recovering from stagflation. The Reagan administration's supply-side reforms stimulated stock and bond markets, causing gold prices to plummet by over 60% within two years. The current scenario is similar. If global growth rebounds to above 3% in 2026 (as predicted by the International Monetary Fund's latest outlook), a recovery in emerging market exports will further diversify gold's dependence on the precious metal. In the short term, the probability of such a trigger is moderate: if the Federal Reserve confirms an additional 50 basis point rate cut at this week's meeting, expectations of a soft landing will strengthen. However, if inflation unexpectedly resurfaces, the recovery could be delayed, giving gold more breathing room.
The dynamic nature of this factor lies in its gradual nature. Unlike sudden events, economic recovery often manifests through leading indicators, such as a rebound in the manufacturing PMI or better-than-expected corporate earnings. Once these signals accumulate, long gold positions will gradually be unwound, and the price will retreat from the current intraday high near $4,043 to support levels between $3,900 and $4,000. Investors should be wary of the quarterly earnings season in Q1 2026 as a potential turning point.
The negative correlation between gold prices and real yields (nominal yields minus inflation) is a well-established market principle. Currently, the 10-year US Treasury yield hovers around 3.8%, while gold's annualized return is only 2-3%, maintaining its competitiveness as a "zero-interest asset." However, if the Federal Reserve pauses its rate-cutting cycle after Q2 2026, and yields rise above 4.5%, large amounts of capital will flow into the bond market, eroding gold's relative value.
A leading investment bank model quantifies this path: for every 1 percentage point increase in yields, gold prices could fall by 3-7%, depending on the inflation anchor. If the market's pricing in an additional 100 basis points of decline by mid-2026 fails to materialize and a hawkish shift occurs, prices will enter a 5-10% consolidation range after testing a potential peak by year-end. Conversely, continued easing would extend the bull market by at least a year, pushing gold prices to challenge resistance between 4100 and 4200. The current environment favors gold: inflation is projected to stabilize at 2.5% in 2025, but a rebound in energy prices or the re-emergence of supply chain bottlenecks could lead to a rapid rise in real yields.
The advantage of this trigger point is its observability. Investors can track the Fed's dot plot and TIPS spreads as leading indicators. Historical data shows that from 2011 to 2015, when yields rebounded from 0% to 2.5%, gold fell from a peak of $1,900 to a low of $1,050, a cumulative retracement of 45%. If this cycle repeats itself, the second half of 2026 will be a critical period for observation, as prices may accelerate their decline when yields reach 4.2%.
Central bank gold purchases have been a structural pillar of this bull market, but their shift toward diversification signals a gradual weakening of that support. Emerging central banks' share of gold holdings has risen to 12%, and net purchases are projected to exceed 800 tons in 2025, far exceeding pre-pandemic averages. However, central bank reserves are not a single basket of assets: gold only accounts for a portion. If the share of other reserve currencies, such as the euro and the renminbi, exceeds 10% (the IMF projects this share will gradually increase by 2030), the pace of gold purchases will slow to 400-500 tons per year. This will not lead to a sudden crash, but rather a shift from structural demand to cyclical maintenance, similar to the "half-time" period gold experienced after the 2008 financial crisis—high price fluctuations but a lack of strong upward momentum.
This perspective is particularly important because it captures the long-term logic of reserve management. Central banks increase their gold holdings to boost returns and reduce dollar exposure, but with the multipolarization of the global payment system, the appeal of other assets, such as Eurobonds or regional currencies, will grow. Data from August 2025 shows that some emerging institutions have begun balancing their allocations, with gold purchases declining by 15% month-over-month. If this trend continues, demand could peak earlier in 2026, pushing prices to plateau after absorbing the highs. Unlike the previous two triggers, this one is more gradual and irreversible: once the reserve structure is optimized, gold will shift from a strategic necessity to a tactical supplement, injecting a "pause" into the bull market.
Furthermore, a surge in supply and geopolitical easing constitute secondary but significant triggers. Mining production is projected to rise by 5% by 2026. If technological breakthroughs (such as efficient mining) accelerate, this supply elasticity will depress the price floor. A potential reconciliation in the Middle East or partial stabilization of the Russia-Ukraine situation could also weaken safe-haven demand. While the probability is low (the current geopolitical risk premium accounts for over 10% of the gold price), if it were to occur, it would amplify the impact of other factors.
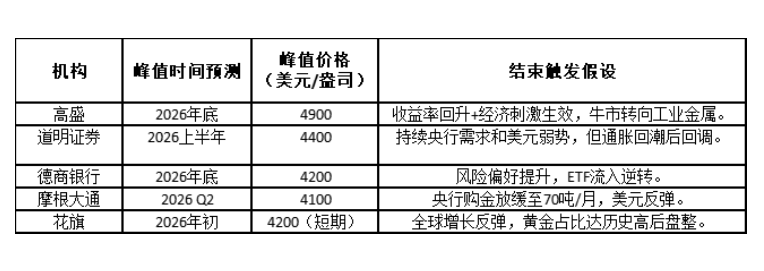
The market outlook suggests that this bull market may reach its peak in mid-2026, followed by a period of high volatility rather than a crash, with the overall cycle likely to continue until 2028-2030. The consensus among leading institutions points to a peak price range of $4,200-4,900, with the end defined as a 20% correction from the peak. Having already firmly broken through $4,000 (with an intraday high of $4,043 and resistance at $4,050 requiring policy catalysts), a more realistic path to a gradual decline is for prices to stabilize between $3,800 and $4,500, awaiting the next round of uncertainty to reignite the upward trend. If the Federal Reserve confirms a rate cut this week, a short-term surge to $4,050-4,100 is possible.
In short, this bull market in gold isn't perpetual, but rather a reflection of a macroeconomic reversal. Its end will unfold gradually, and investors should monitor the yield curve, economic data, and central bank reports for dynamic investment signals. In an era dominated by uncertainty, a "pause" in gold's performance, rather than its "end," may be the most pragmatic expectation.
What are the potential triggers for the end of gold's current bull market? This article will focus on potential triggers, analyzing key factors such as the global economic recovery, rising bond yields, and central bank asset allocation adjustments, and explore the transition path from the bull market's peak to high-level fluctuations.
The core drivers of this bull market lie in the dual forces of "low yields and high uncertainty." Since 2024, the Federal Reserve has cut interest rates by 150 basis points, pushing the 10-year Treasury yield to a low of approximately 3.6%, reducing the opportunity cost of gold to a historic low. Furthermore, geopolitical uncertainties—including the Russia-Ukraine situation and tensions in the Middle East—combined with risk aversion fueled by tariff talk have further fueled demand. Central bank gold purchases are particularly crucial, with emerging market institutions increasing their gold reserves from a historic low to over 12%, viewing it as a strategic asset to support currency stability. This "de-dollarization" process, while slow, provides a solid floor for prices. However, historical evidence shows that gold bull markets often enter a consolidation phase after reversal signals emerge: Following the collapse of the Bretton Woods system in 1971, gold prices soared to a peak of $850 per ounce in 1980, only to halve by more than 50% during the economic recovery. The current cycle is similarly poised to see prices fall 10-20% from current highs once the trigger is activated, marking the end of the "main phase" of the cycle.
Global economic recovery: a "soft landing" signal as risk appetite rebounds
An improving global economy is the classic catalyst for the end of a bull market. By boosting risk appetite, it directly erodes gold's safe-haven premium. If the Federal Reserve's stimulus policies in 2026—including potential fiscal expansion—take effect as expected, US GDP growth could exceed the current forecast range of 2.5-3%. This would cause global capital to shift from safe-haven assets to higher-yield opportunities such as stocks and industrial metals. This would reshape the structure of gold demand: investors would shift to an "opportunity cost" model, ETF inflows would reverse, and central bank gold purchases could slow.
Reputable analysts indicate that if the US rolls out a large-scale infrastructure or consumer stimulus bill in the first half of 2026, driving a rebound in employment and investment, gold prices will face significant downward pressure. Funds will shift to cyclical commodities like copper and aluminum, which are more resilient during economic expansions, while gold's relative appeal as a non-productive asset will decline. Historical parallels are striking: after the 1980 gold peak, the US economy was recovering from stagflation. The Reagan administration's supply-side reforms stimulated stock and bond markets, causing gold prices to plummet by over 60% within two years. The current scenario is similar. If global growth rebounds to above 3% in 2026 (as predicted by the International Monetary Fund's latest outlook), a recovery in emerging market exports will further diversify gold's dependence on the precious metal. In the short term, the probability of such a trigger is moderate: if the Federal Reserve confirms an additional 50 basis point rate cut at this week's meeting, expectations of a soft landing will strengthen. However, if inflation unexpectedly resurfaces, the recovery could be delayed, giving gold more breathing room.
The dynamic nature of this factor lies in its gradual nature. Unlike sudden events, economic recovery often manifests through leading indicators, such as a rebound in the manufacturing PMI or better-than-expected corporate earnings. Once these signals accumulate, long gold positions will gradually be unwound, and the price will retreat from the current intraday high near $4,043 to support levels between $3,900 and $4,000. Investors should be wary of the quarterly earnings season in Q1 2026 as a potential turning point.
Treasury yield reversal: the quantitative shackles of opportunity cost
The negative correlation between gold prices and real yields (nominal yields minus inflation) is a well-established market principle. Currently, the 10-year US Treasury yield hovers around 3.8%, while gold's annualized return is only 2-3%, maintaining its competitiveness as a "zero-interest asset." However, if the Federal Reserve pauses its rate-cutting cycle after Q2 2026, and yields rise above 4.5%, large amounts of capital will flow into the bond market, eroding gold's relative value.
A leading investment bank model quantifies this path: for every 1 percentage point increase in yields, gold prices could fall by 3-7%, depending on the inflation anchor. If the market's pricing in an additional 100 basis points of decline by mid-2026 fails to materialize and a hawkish shift occurs, prices will enter a 5-10% consolidation range after testing a potential peak by year-end. Conversely, continued easing would extend the bull market by at least a year, pushing gold prices to challenge resistance between 4100 and 4200. The current environment favors gold: inflation is projected to stabilize at 2.5% in 2025, but a rebound in energy prices or the re-emergence of supply chain bottlenecks could lead to a rapid rise in real yields.
The advantage of this trigger point is its observability. Investors can track the Fed's dot plot and TIPS spreads as leading indicators. Historical data shows that from 2011 to 2015, when yields rebounded from 0% to 2.5%, gold fell from a peak of $1,900 to a low of $1,050, a cumulative retracement of 45%. If this cycle repeats itself, the second half of 2026 will be a critical period for observation, as prices may accelerate their decline when yields reach 4.2%.
Diversification of central bank asset allocation: from aggressive support to cyclical maintenance
Central bank gold purchases have been a structural pillar of this bull market, but their shift toward diversification signals a gradual weakening of that support. Emerging central banks' share of gold holdings has risen to 12%, and net purchases are projected to exceed 800 tons in 2025, far exceeding pre-pandemic averages. However, central bank reserves are not a single basket of assets: gold only accounts for a portion. If the share of other reserve currencies, such as the euro and the renminbi, exceeds 10% (the IMF projects this share will gradually increase by 2030), the pace of gold purchases will slow to 400-500 tons per year. This will not lead to a sudden crash, but rather a shift from structural demand to cyclical maintenance, similar to the "half-time" period gold experienced after the 2008 financial crisis—high price fluctuations but a lack of strong upward momentum.
This perspective is particularly important because it captures the long-term logic of reserve management. Central banks increase their gold holdings to boost returns and reduce dollar exposure, but with the multipolarization of the global payment system, the appeal of other assets, such as Eurobonds or regional currencies, will grow. Data from August 2025 shows that some emerging institutions have begun balancing their allocations, with gold purchases declining by 15% month-over-month. If this trend continues, demand could peak earlier in 2026, pushing prices to plateau after absorbing the highs. Unlike the previous two triggers, this one is more gradual and irreversible: once the reserve structure is optimized, gold will shift from a strategic necessity to a tactical supplement, injecting a "pause" into the bull market.
Secondary trigger points: the auxiliary role of supply-side and geopolitical variables
Furthermore, a surge in supply and geopolitical easing constitute secondary but significant triggers. Mining production is projected to rise by 5% by 2026. If technological breakthroughs (such as efficient mining) accelerate, this supply elasticity will depress the price floor. A potential reconciliation in the Middle East or partial stabilization of the Russia-Ukraine situation could also weaken safe-haven demand. While the probability is low (the current geopolitical risk premium accounts for over 10% of the gold price), if it were to occur, it would amplify the impact of other factors.
The market outlook suggests that this bull market may reach its peak in mid-2026, followed by a period of high volatility rather than a crash, with the overall cycle likely to continue until 2028-2030. The consensus among leading institutions points to a peak price range of $4,200-4,900, with the end defined as a 20% correction from the peak. Having already firmly broken through $4,000 (with an intraday high of $4,043 and resistance at $4,050 requiring policy catalysts), a more realistic path to a gradual decline is for prices to stabilize between $3,800 and $4,500, awaiting the next round of uncertainty to reignite the upward trend. If the Federal Reserve confirms a rate cut this week, a short-term surge to $4,050-4,100 is possible.
In short, this bull market in gold isn't perpetual, but rather a reflection of a macroeconomic reversal. Its end will unfold gradually, and investors should monitor the yield curve, economic data, and central bank reports for dynamic investment signals. In an era dominated by uncertainty, a "pause" in gold's performance, rather than its "end," may be the most pragmatic expectation.
- Risk Warning and Disclaimer
- The market involves risk, and trading may not be suitable for all investors. This article is for reference only and does not constitute personal investment advice, nor does it take into account certain users’ specific investment objectives, financial situation, or other needs. Any investment decisions made based on this information are at your own risk.