In an era where “everything goes up”, where does the pricing anchor for gold come from?
2025-10-09 21:19:09
Spot gold traded around $4,050 during the North American trading session on Thursday (October 9). The price briefly surged to $4,059.07 in the previous trading day, effectively crossing the psychological barrier of $4,000 for the first time. However, it retreated to around $4,000 before pulling back again, indicating that bulls were switching between pushing higher and digesting the gains.
The main driver of this rally isn't simply panic buying, but rather a liquidity story that showcases a rare convergence of risk appetite and safe-haven demand. Equity markets and the US dollar have strengthened simultaneously, reflecting a complex mix of expectations for monetary easing and growth uncertainty. For gold, this multifaceted dynamic fosters resilience. As the market bets on two more Fed rate cuts this year, nominal and real yields are under pressure, reducing the opportunity cost of non-yielding assets and benefiting gold. Meanwhile, geopolitical tail risks persist: despite a temporary easing, tensions in the Middle East remain volatile, and uncertainty remains. Political dynamics in Europe and Japan are also extending the lifespan of defensive positions.
Another "slow variable" at the macro level comes from official sources: global central banks continue to accumulate gold reserves at high levels, reflecting a long-term commitment to the fiat currency credit cycle and reserve diversification. This structural buying, independent of short-term fluctuations, provides a foundation for gold's trend. The US federal government shutdown entered its ninth day, and the delay in the release of key macroeconomic data (NFP, initial jobless claims, etc.) has left both the market and central banks with low visibility. As model uncertainty increases, risk budgets naturally tilt toward gold.
In terms of policy communication, the dovish tone of the New York Fed President and the FOMC minutes, which stated that "most officials support further rate cuts this year but are wary of persistent inflation," have reinforced the market consensus that easing remains on track, but the pace remains cautious. This expectation—coupled with the rare combination of weakening yields, a strong dollar, and continued risk asset volatility—explains why gold has remained resilient despite a broad asset rally: it serves as both an insurance policy and a liquidity trade.
Finally, the lackluster performance of bond yields has increased gold's relative appeal. The extended uncertainty surrounding the government shutdown has created a gap in the economic data pipeline, reinforcing the need to mitigate tail risks. Overall, fundamentals remain bullish, but catalysts for short-term volatility (such as the duration of the shutdown, data recovery, and geopolitical news) are also numerous, leading to a fluctuating trajectory.
The daily chart shows that spot gold has been moving in a strong upward trend since mid-to-late September, recently exhibiting a "Bollinger Band" pattern. The upper Bollinger Band is 4041.60, the middle Bollinger Band is 3759.87, and the lower Bollinger Band is 3478.13. The current price is trading above the upper Bollinger Band, indicating a strong trend and strong momentum, but also suggests that the risk of short-term "overshooting-mean reversion" is accumulating. Horizontally, 3890.00 has become a near-term static support level, serving as both a reference for a breakout and a threshold for maintaining a bullish structure. Further below, the middle Bollinger Band at 3759.87 marks the medium-term trend line dividing strength and weakness.
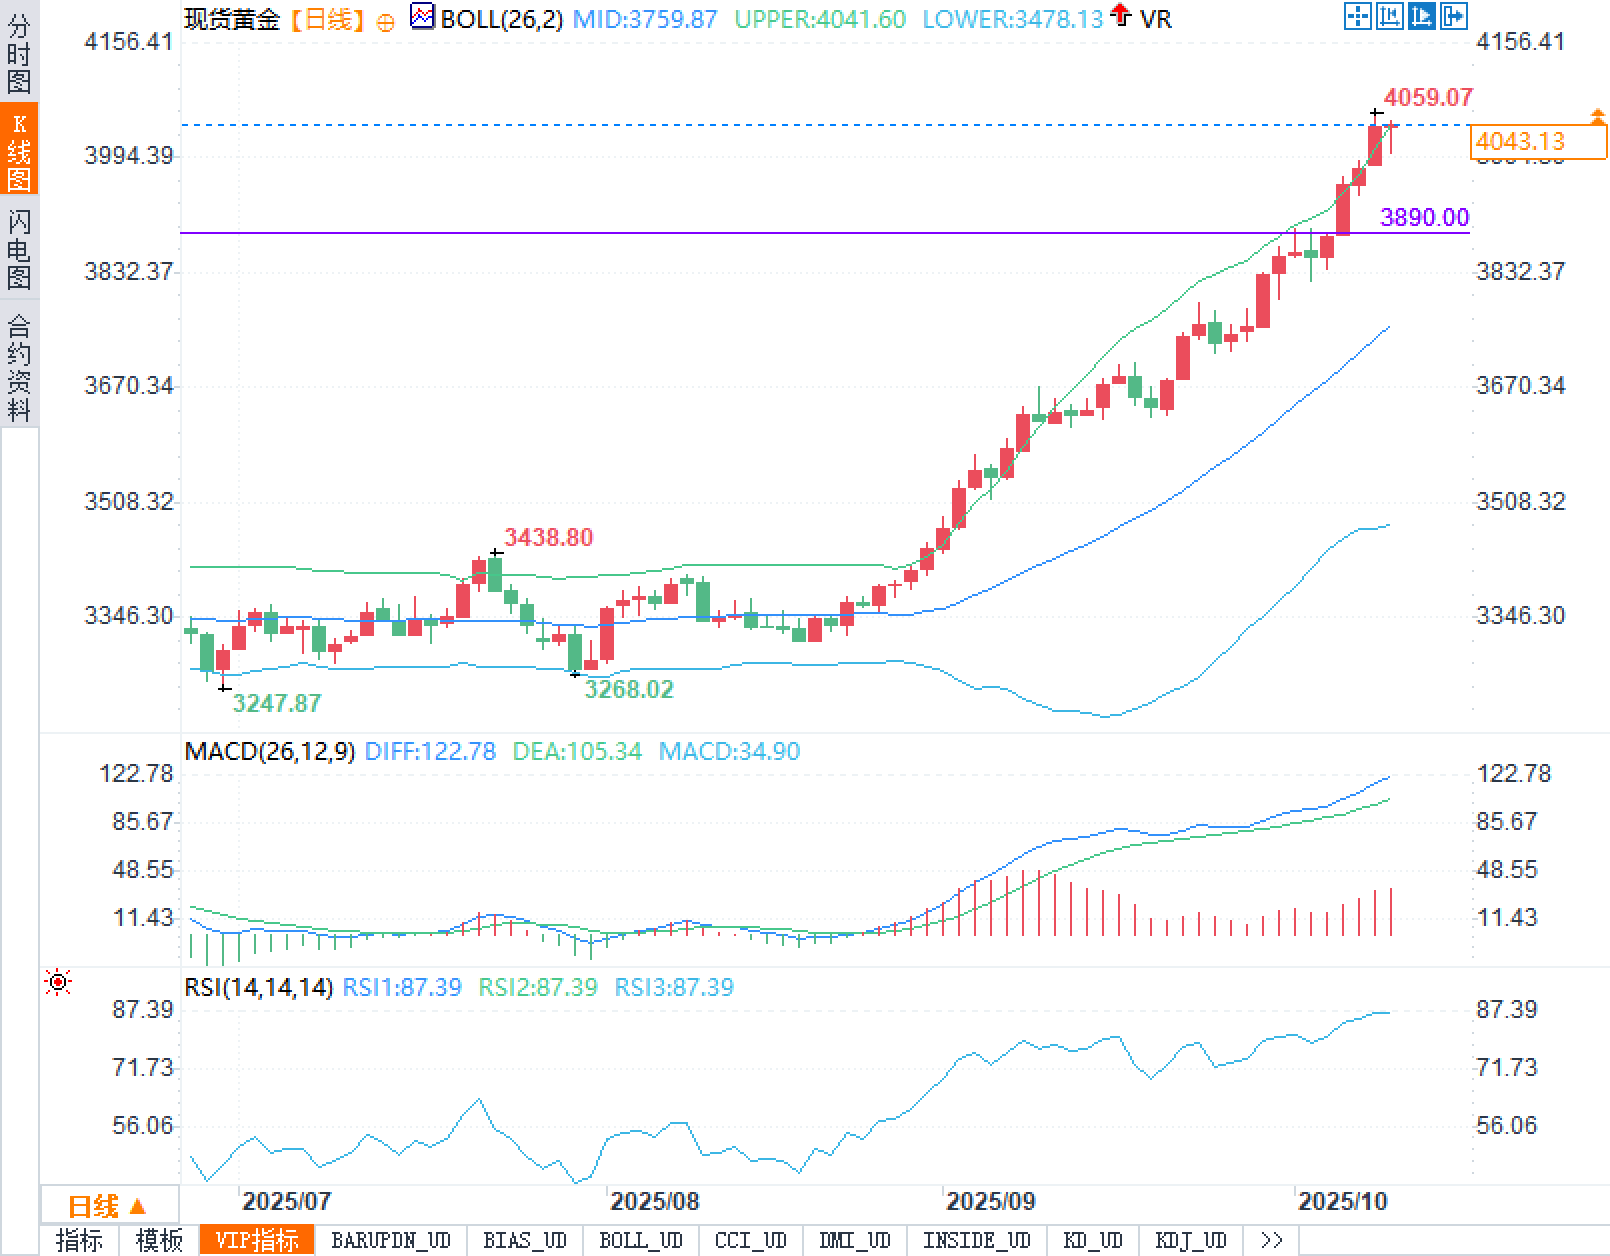
On the momentum side, the MACD DIFF is 122.78, the DEA is 105.34, and the histogram is 34.90, indicating that bullish momentum is still expanding and no obvious top divergence has been seen. However, the RSI (14) has reached the extreme range of 87.39, a typical "overbought + acceleration" combination, which often first brings about high-level fluctuations in the time dimension to relieve indicator pressure, and then the trend determines the outcome. If the subsequent K-line has a long upper shadow or a shortened body, it is necessary to guard against the rhythm switching of "acceleration → exhaustion → retracement"; on the contrary, as long as the price continues to rise along the upper track and the retracement is quickly recovered in the 3890.00-4041.60 range, the "Bollinger Band expansion-mean shift" trend structure will still be dominant.
The emotional level presents a "triple resonance":
First, both "loose trading" and "hedge trading" are active. The upward trend of the equity market sends an optimistic signal, while the government shutdown, data gaps, and geopolitical variables reinforce the need to allocate gold, forming a typical scenario of "greed and fear resonating."
Second, the "missing opportunity" mentality is on the rise. The strong short squeeze after breaking through 4000 led to short-covering and trend-following trading, resulting in considerable short-term trading volume. However, when the RSI climbs to extreme values, the marginal efficiency of chasing the gains begins to decline, making it easy to see "shrinking volume rises or strong price but weak volume" situations, and technical turnover is inevitable.
Third, the consensus is not fully priced in. The market remains divided over the pace of interest rate cuts, and there's uncertainty about the stability of political issues in the Middle East and Europe. Given this incomplete consensus, gold's "insurance" attributes still command a premium, but its pricing will be more dependent on news shocks and the pace of data recovery. Overall sentiment is bullish but not overheated, trending toward a "highly volatile bullish market," with a higher tolerance for pullbacks and greater sensitivity to breaking news.
Fundamentals:
The main driver of this rally isn't simply panic buying, but rather a liquidity story that showcases a rare convergence of risk appetite and safe-haven demand. Equity markets and the US dollar have strengthened simultaneously, reflecting a complex mix of expectations for monetary easing and growth uncertainty. For gold, this multifaceted dynamic fosters resilience. As the market bets on two more Fed rate cuts this year, nominal and real yields are under pressure, reducing the opportunity cost of non-yielding assets and benefiting gold. Meanwhile, geopolitical tail risks persist: despite a temporary easing, tensions in the Middle East remain volatile, and uncertainty remains. Political dynamics in Europe and Japan are also extending the lifespan of defensive positions.
Another "slow variable" at the macro level comes from official sources: global central banks continue to accumulate gold reserves at high levels, reflecting a long-term commitment to the fiat currency credit cycle and reserve diversification. This structural buying, independent of short-term fluctuations, provides a foundation for gold's trend. The US federal government shutdown entered its ninth day, and the delay in the release of key macroeconomic data (NFP, initial jobless claims, etc.) has left both the market and central banks with low visibility. As model uncertainty increases, risk budgets naturally tilt toward gold.
In terms of policy communication, the dovish tone of the New York Fed President and the FOMC minutes, which stated that "most officials support further rate cuts this year but are wary of persistent inflation," have reinforced the market consensus that easing remains on track, but the pace remains cautious. This expectation—coupled with the rare combination of weakening yields, a strong dollar, and continued risk asset volatility—explains why gold has remained resilient despite a broad asset rally: it serves as both an insurance policy and a liquidity trade.
Finally, the lackluster performance of bond yields has increased gold's relative appeal. The extended uncertainty surrounding the government shutdown has created a gap in the economic data pipeline, reinforcing the need to mitigate tail risks. Overall, fundamentals remain bullish, but catalysts for short-term volatility (such as the duration of the shutdown, data recovery, and geopolitical news) are also numerous, leading to a fluctuating trajectory.
Technical aspects:
The daily chart shows that spot gold has been moving in a strong upward trend since mid-to-late September, recently exhibiting a "Bollinger Band" pattern. The upper Bollinger Band is 4041.60, the middle Bollinger Band is 3759.87, and the lower Bollinger Band is 3478.13. The current price is trading above the upper Bollinger Band, indicating a strong trend and strong momentum, but also suggests that the risk of short-term "overshooting-mean reversion" is accumulating. Horizontally, 3890.00 has become a near-term static support level, serving as both a reference for a breakout and a threshold for maintaining a bullish structure. Further below, the middle Bollinger Band at 3759.87 marks the medium-term trend line dividing strength and weakness.
On the momentum side, the MACD DIFF is 122.78, the DEA is 105.34, and the histogram is 34.90, indicating that bullish momentum is still expanding and no obvious top divergence has been seen. However, the RSI (14) has reached the extreme range of 87.39, a typical "overbought + acceleration" combination, which often first brings about high-level fluctuations in the time dimension to relieve indicator pressure, and then the trend determines the outcome. If the subsequent K-line has a long upper shadow or a shortened body, it is necessary to guard against the rhythm switching of "acceleration → exhaustion → retracement"; on the contrary, as long as the price continues to rise along the upper track and the retracement is quickly recovered in the 3890.00-4041.60 range, the "Bollinger Band expansion-mean shift" trend structure will still be dominant.
Market sentiment observation:
The emotional level presents a "triple resonance":
First, both "loose trading" and "hedge trading" are active. The upward trend of the equity market sends an optimistic signal, while the government shutdown, data gaps, and geopolitical variables reinforce the need to allocate gold, forming a typical scenario of "greed and fear resonating."
Second, the "missing opportunity" mentality is on the rise. The strong short squeeze after breaking through 4000 led to short-covering and trend-following trading, resulting in considerable short-term trading volume. However, when the RSI climbs to extreme values, the marginal efficiency of chasing the gains begins to decline, making it easy to see "shrinking volume rises or strong price but weak volume" situations, and technical turnover is inevitable.
Third, the consensus is not fully priced in. The market remains divided over the pace of interest rate cuts, and there's uncertainty about the stability of political issues in the Middle East and Europe. Given this incomplete consensus, gold's "insurance" attributes still command a premium, but its pricing will be more dependent on news shocks and the pace of data recovery. Overall sentiment is bullish but not overheated, trending toward a "highly volatile bullish market," with a higher tolerance for pullbacks and greater sensitivity to breaking news.
- Risk Warning and Disclaimer
- The market involves risk, and trading may not be suitable for all investors. This article is for reference only and does not constitute personal investment advice, nor does it take into account certain users’ specific investment objectives, financial situation, or other needs. Any investment decisions made based on this information are at your own risk.