


A 6.3% plunge! Did the gold bull market suddenly "die"? The game between the central bank and speculation has just begun.
2025-10-22 16:00:01
During the Asian and European trading hours on Wednesday (October 22nd), spot gold prices bottomed out and rebounded, forming a V-shaped reversal. At one point, it dipped as low as -3% before currently trading around 4140, up 0.36%. This followed Tuesday's sharpest sell-off in years. The core drivers of this sell-off included the recent surge in gold prices, the waning of gold buying euphoria, and the cashing-in of numerous favorable gold news.
Spot gold plunged as much as 6.3% during the previous trading day—its largest single-day drop in over a decade—while silver plummeted as low as 8.7% during Tuesday's session. Notably, this plunge was triggered by technical indicators clearly indicating overextended prices and exposing high sentiment, a point I've mentioned repeatedly in previous articles.
"The sell-off driven by technical overbought conditions is the primary driver of this correction," said Suki Cooper, head of commodities research at Standard Chartered Bank. "Prices have been trading in overbought territory since early September," she added, adding that the bank maintains its forecast for gold to resume its upward momentum next year.
From a trading perspective, this pullback directly ends the rapid upward cycle that began in mid-August. Two key drivers of gold's recent rally include the prevalence of "downtrading" strategies—investors hedging against runaway budget deficits by avoiding sovereign debt and fiat assets—and market bets on at least one significant interest rate cut by the Federal Reserve before the end of the year. Even with this pullback, gold's year-to-date gains remain close to 60%.
From the news perspective, trade issues between China and the United States, India and the United States, conflicts between Russia and Ukraine, and between Palestine and Israel, and the US government shutdown are all key factors that have accelerated the recent growth of gold.
Positive news, including Tuesday's positive comments from Trump regarding a trade deal with his Chinese counterpart, the signing of a ceasefire agreement between Israel and Palestine, the upcoming round of Russia-Ukraine negotiations, and the White House's announcement that government operations could resume this weekend, coupled with Friday's release of delayed CPI data from the U.S. Department of Labor, confirming the government shutdown may be coming to an end. All of this has driven gold bulls to cash in on their gains. Previous articles have highlighted the potential for early gold cashing-in.
It is worth noting that the end of Diwali in India, the world's second largest gold consumer, and the reduction in physical demand are another reason for the decline in gold prices.
Meanwhile, reports indicate that the United States is close to finalizing a trade agreement with India, which would set tariffs in the 15%-16% range. This is a significantly lower level for India, one of the world's most protectionist countries. This development may also signal further downward pressure on tariffs between the United States and some of its trading partners, signaling a reduction in risk aversion.
The US government shutdown also raises a key issue: traders have lost a crucial tool for analyzing market sentiment: the Commodity Futures Trading Commission's (CFTC) weekly positions report. This report typically reveals the structure of hedge funds and other asset managers' holdings in US gold and silver futures. Without this data, speculative funds are more likely to form unilateral, unusual positions.
Although spot price fluctuations have temporarily subsided, traders are using options to position themselves in advance to mitigate the risk of subsequent volatility. One-month implied volatility has climbed to levels not seen since March 2022, a clear signal that market expectations for price volatility are rising.
Silver's recent market fluctuations are even more dramatic than gold's. On Tuesday, the silver inventory in the designated vaults of the Shanghai Futures Exchange saw the largest single-day outflow since February, and inventories in the New York market also declined simultaneously. Silver fell as much as 8.7% during trading on Tuesday.
Last week's historic squeeze in the London market pushed silver prices above their all-time high set in 1980. Back then, the London benchmark price was significantly higher than New York futures, a price differential that encouraged traders to ship physical silver to London to ease local supply constraints.
Nick Twedale, chief market analyst at AT Global Markets in Sydney, said that from a technical perspective, the current gold trend is a correction, although "the correction is beyond the norm."
"My core assessment is that the previous market move was driven by a large-scale reallocation of funds, while this correction is due to profit-taking by some large investors. Stop-loss orders triggered during the decline further amplified the decline," he explained. "If the price effectively falls below $4,000, the market will likely see a larger sell-off."
Precious metals volatility has surged significantly in recent trading sessions, leading to diverging trader strategies: some are using hedging tools to protect against potential downside risks in other portfolio assets, while others are seeking to capitalize on these fluctuations. Last Thursday and Friday, trading volume in options contracts related to the world's largest gold ETF reached record highs.
Anna Wu, cross-asset strategist at Van Eck Associates in Sydney, believes that gold's pullback so far "has not triggered cross-market contagion risks." "Even after its recent strong rally, gold's core safe-haven properties remain intact. From a funding perspective, central banks continue to increase their holdings, and there has been no large-scale withdrawal of private capital."
Citigroup downgraded its overweight rating on gold after Tuesday's plunge, citing the risk of over-concentration in the market. Strategists including Charlie Massey-Collier of the bank clearly stated in a report that they expect gold to enter a deeper consolidation phase around $4,000 per ounce in the coming weeks.
“In the long term, the core theme of the gold bull market logic, that central banks continue to promote de-dollarization and achieve reserve diversification, is still expected to dominate the market again,” they wrote in the report, adding that the current price “has exceeded the reasonable range supported by the ‘depreciation trade’ logic.”
The Trump administration's radical moves to reshape the global trade landscape, coupled with escalating geopolitical uncertainty, have provided significant support for the upward trend in precious metals prices this year. Furthermore, central banks have continued to increase their gold holdings to diversify their foreign exchange reserves and reduce reliance on the US dollar. Retail investors, eager to capitalize on the rally, have also driven inflows into gold ETFs, further strengthening upward momentum.
Recent articles have been reminding of the risks of gold prices. Yesterday's analysis and deduction of gold prices also happened to coincide with the actual trend. From the time-sharing chart, we can see that the measured decline of the double top is 4005, which has been reached now. After that, the gold price rebounded. 4190 is the first pressure level and also the neckline of the double top. The support is at 4128, which is the neckline of the bottom-breaking reversal pattern. The gold price can continue to be bullish at this level.
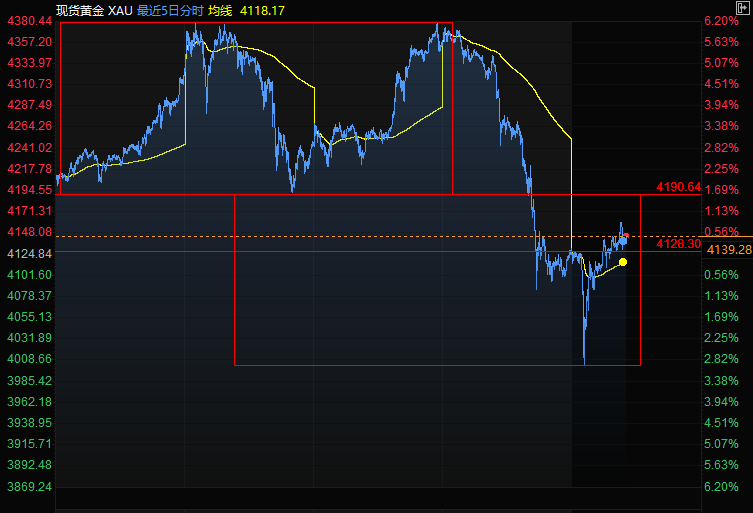
(Spot gold time-sharing chart)
From the daily chart, we can see that the gold price started to rebound after touching the lower track of the rising channel. It is currently constrained by the upper track of the rising channel and the 10-day line, which is also the recent resistance level. The subsequent maximum pressure level of gold is at 4239.70, which is also the 50% percentile of the falling negative line of gold price on October 21.
The current support is around 4083, which is the intersection of the low point on October 21 and the rising channel.
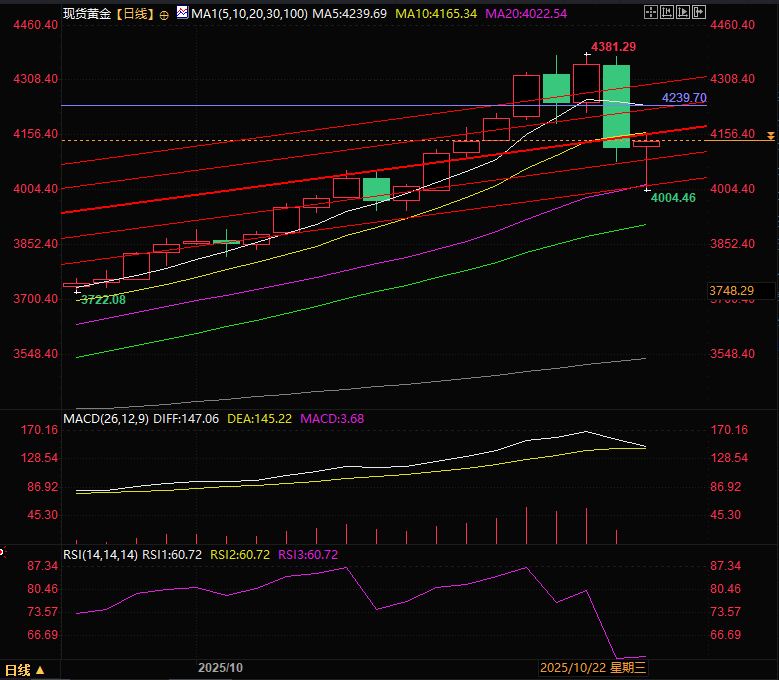
(Spot gold daily chart, source: Yihuitong)
At 15:57 Beijing time, spot gold was trading at $4,132 per ounce.
Spot gold plunged as much as 6.3% during the previous trading day—its largest single-day drop in over a decade—while silver plummeted as low as 8.7% during Tuesday's session. Notably, this plunge was triggered by technical indicators clearly indicating overextended prices and exposing high sentiment, a point I've mentioned repeatedly in previous articles.
Overbought trading is a major reason for the short-term gold price correction
"The sell-off driven by technical overbought conditions is the primary driver of this correction," said Suki Cooper, head of commodities research at Standard Chartered Bank. "Prices have been trading in overbought territory since early September," she added, adding that the bank maintains its forecast for gold to resume its upward momentum next year.
From a trading perspective, this pullback directly ends the rapid upward cycle that began in mid-August. Two key drivers of gold's recent rally include the prevalence of "downtrading" strategies—investors hedging against runaway budget deficits by avoiding sovereign debt and fiat assets—and market bets on at least one significant interest rate cut by the Federal Reserve before the end of the year. Even with this pullback, gold's year-to-date gains remain close to 60%.
The realization of good news is another major reason for the gold price correction
From the news perspective, trade issues between China and the United States, India and the United States, conflicts between Russia and Ukraine, and between Palestine and Israel, and the US government shutdown are all key factors that have accelerated the recent growth of gold.
Positive news, including Tuesday's positive comments from Trump regarding a trade deal with his Chinese counterpart, the signing of a ceasefire agreement between Israel and Palestine, the upcoming round of Russia-Ukraine negotiations, and the White House's announcement that government operations could resume this weekend, coupled with Friday's release of delayed CPI data from the U.S. Department of Labor, confirming the government shutdown may be coming to an end. All of this has driven gold bulls to cash in on their gains. Previous articles have highlighted the potential for early gold cashing-in.
It is worth noting that the end of Diwali in India, the world's second largest gold consumer, and the reduction in physical demand are another reason for the decline in gold prices.
Meanwhile, reports indicate that the United States is close to finalizing a trade agreement with India, which would set tariffs in the 15%-16% range. This is a significantly lower level for India, one of the world's most protectionist countries. This development may also signal further downward pressure on tariffs between the United States and some of its trading partners, signaling a reduction in risk aversion.
Data black holes strengthen the golden amplitude
The US government shutdown also raises a key issue: traders have lost a crucial tool for analyzing market sentiment: the Commodity Futures Trading Commission's (CFTC) weekly positions report. This report typically reveals the structure of hedge funds and other asset managers' holdings in US gold and silver futures. Without this data, speculative funds are more likely to form unilateral, unusual positions.
Although spot price fluctuations have temporarily subsided, traders are using options to position themselves in advance to mitigate the risk of subsequent volatility. One-month implied volatility has climbed to levels not seen since March 2022, a clear signal that market expectations for price volatility are rising.
The resonance of related varieties exacerbates gold price fluctuations
Silver's recent market fluctuations are even more dramatic than gold's. On Tuesday, the silver inventory in the designated vaults of the Shanghai Futures Exchange saw the largest single-day outflow since February, and inventories in the New York market also declined simultaneously. Silver fell as much as 8.7% during trading on Tuesday.
Last week's historic squeeze in the London market pushed silver prices above their all-time high set in 1980. Back then, the London benchmark price was significantly higher than New York futures, a price differential that encouraged traders to ship physical silver to London to ease local supply constraints.
Institutional Views:
Nick Twedale, chief market analyst at AT Global Markets in Sydney, said that from a technical perspective, the current gold trend is a correction, although "the correction is beyond the norm."
"My core assessment is that the previous market move was driven by a large-scale reallocation of funds, while this correction is due to profit-taking by some large investors. Stop-loss orders triggered during the decline further amplified the decline," he explained. "If the price effectively falls below $4,000, the market will likely see a larger sell-off."
Precious metals volatility has surged significantly in recent trading sessions, leading to diverging trader strategies: some are using hedging tools to protect against potential downside risks in other portfolio assets, while others are seeking to capitalize on these fluctuations. Last Thursday and Friday, trading volume in options contracts related to the world's largest gold ETF reached record highs.
Anna Wu, cross-asset strategist at Van Eck Associates in Sydney, believes that gold's pullback so far "has not triggered cross-market contagion risks." "Even after its recent strong rally, gold's core safe-haven properties remain intact. From a funding perspective, central banks continue to increase their holdings, and there has been no large-scale withdrawal of private capital."
Citigroup downgraded its overweight rating on gold after Tuesday's plunge, citing the risk of over-concentration in the market. Strategists including Charlie Massey-Collier of the bank clearly stated in a report that they expect gold to enter a deeper consolidation phase around $4,000 per ounce in the coming weeks.
“In the long term, the core theme of the gold bull market logic, that central banks continue to promote de-dollarization and achieve reserve diversification, is still expected to dominate the market again,” they wrote in the report, adding that the current price “has exceeded the reasonable range supported by the ‘depreciation trade’ logic.”
The Trump administration's radical moves to reshape the global trade landscape, coupled with escalating geopolitical uncertainty, have provided significant support for the upward trend in precious metals prices this year. Furthermore, central banks have continued to increase their gold holdings to diversify their foreign exchange reserves and reduce reliance on the US dollar. Retail investors, eager to capitalize on the rally, have also driven inflows into gold ETFs, further strengthening upward momentum.
Technical Analysis:
Recent articles have been reminding of the risks of gold prices. Yesterday's analysis and deduction of gold prices also happened to coincide with the actual trend. From the time-sharing chart, we can see that the measured decline of the double top is 4005, which has been reached now. After that, the gold price rebounded. 4190 is the first pressure level and also the neckline of the double top. The support is at 4128, which is the neckline of the bottom-breaking reversal pattern. The gold price can continue to be bullish at this level.
(Spot gold time-sharing chart)
From the daily chart, we can see that the gold price started to rebound after touching the lower track of the rising channel. It is currently constrained by the upper track of the rising channel and the 10-day line, which is also the recent resistance level. The subsequent maximum pressure level of gold is at 4239.70, which is also the 50% percentile of the falling negative line of gold price on October 21.
The current support is around 4083, which is the intersection of the low point on October 21 and the rising channel.
(Spot gold daily chart, source: Yihuitong)
At 15:57 Beijing time, spot gold was trading at $4,132 per ounce.
- Risk Warning and Disclaimer
- The market involves risk, and trading may not be suitable for all investors. This article is for reference only and does not constitute personal investment advice, nor does it take into account certain users’ specific investment objectives, financial situation, or other needs. Any investment decisions made based on this information are at your own risk.


