Two days of shock for gold: from overheating to cooling, has the market entered a "healthy adjustment"?
2025-10-22 20:37:23
On Wednesday (October 22nd), spot gold trading saw increased volatility, trading above $4,000 before the US market opened. This followed a rapid retreat from its peak, reaching $4,161 in the European session before coming under renewed pressure. This marked a significant retracement from the previous peak of $4,381.29, highlighting the market's growing sensitivity to the shift between offense and defense at the $4,000 mark.
The direct drivers of gold's short-term weakness remain the strengthening US dollar and a temporary recovery in risk appetite. A stronger dollar has increased holding costs, dampening overseas buying. Meanwhile, US Treasury yields have remained subdued, providing a buffer for non-interest-bearing assets and preventing further declines.
The $4,000 mark, a significant psychological barrier, attracted dip-hunting and tentative entry from left-side investors. While covering buying drove the intraday rebound, its strength was limited, indicating that the upward momentum was still being digested after the pullback from the highs. Technical overheating following a continuous rise from highs was one of the internal factors of this pullback: the previous period of steep upward slope, momentum indicators accumulated to extreme levels, and profit-taking triggered a typical mean-reversion process of "rapid rise and fall."
On the external macroeconomic front, expectations of tariff-related tensions have cooled temporarily, safe-haven demand has retreated marginally, and gold's traditional "crisis premium" has been released. Meanwhile, fiscal uncertainty persists: the US government shutdown, now stretching into its 22nd day, continues to erode economic activity and confidence. The conflicting forces on safe-haven sentiment and the US dollar are creating a short-term tug-of-war.
Regarding forward-looking data, this week's US inflation (CPI) and the preliminary October Purchasing Managers' Index will be in focus. Market expectations are converging on a modest 25 basis point rate cut at the Federal Reserve's October 29-30 meeting. If both month-over-month inflation and core inflation readings continue to weaken, this will further solidify the "moderately dovish" policy stance. A sticky upward trend will dampen the resilience of precious metals. Overall, declining policy uncertainty has an asymmetric impact on gold: if a dovish stance materializes, nominal and real yields will decline, positive for gold prices. If inflation unexpectedly strengthens, a rise in the US dollar and yields will weigh on gold prices.
Central bank gold purchases and geopolitical uncertainty remain key pillars of the medium- to long-term bottoming logic. Even if short-term indicators of congestion and overheating pull back, structural allocation forces remain, maintaining a bottoming logic for bulls that the market will not fall too far.
The daily chart shows a clear opening of the Bollinger Bands: upper band 4356.98, lower band 3532.67, and middle band 3944.83. The price is currently trading in the upper half of the range, above the middle band and below the upper band, indicating that the medium-term uptrend has not been broken, but the acceleration has slowed. The previous high of 4381.29 constitutes a temporary "supply concentration zone," while 4100 has been a key watershed in the past two days. The price has repeatedly tested this level but failed to hold, turning it into a short-term resistance level.
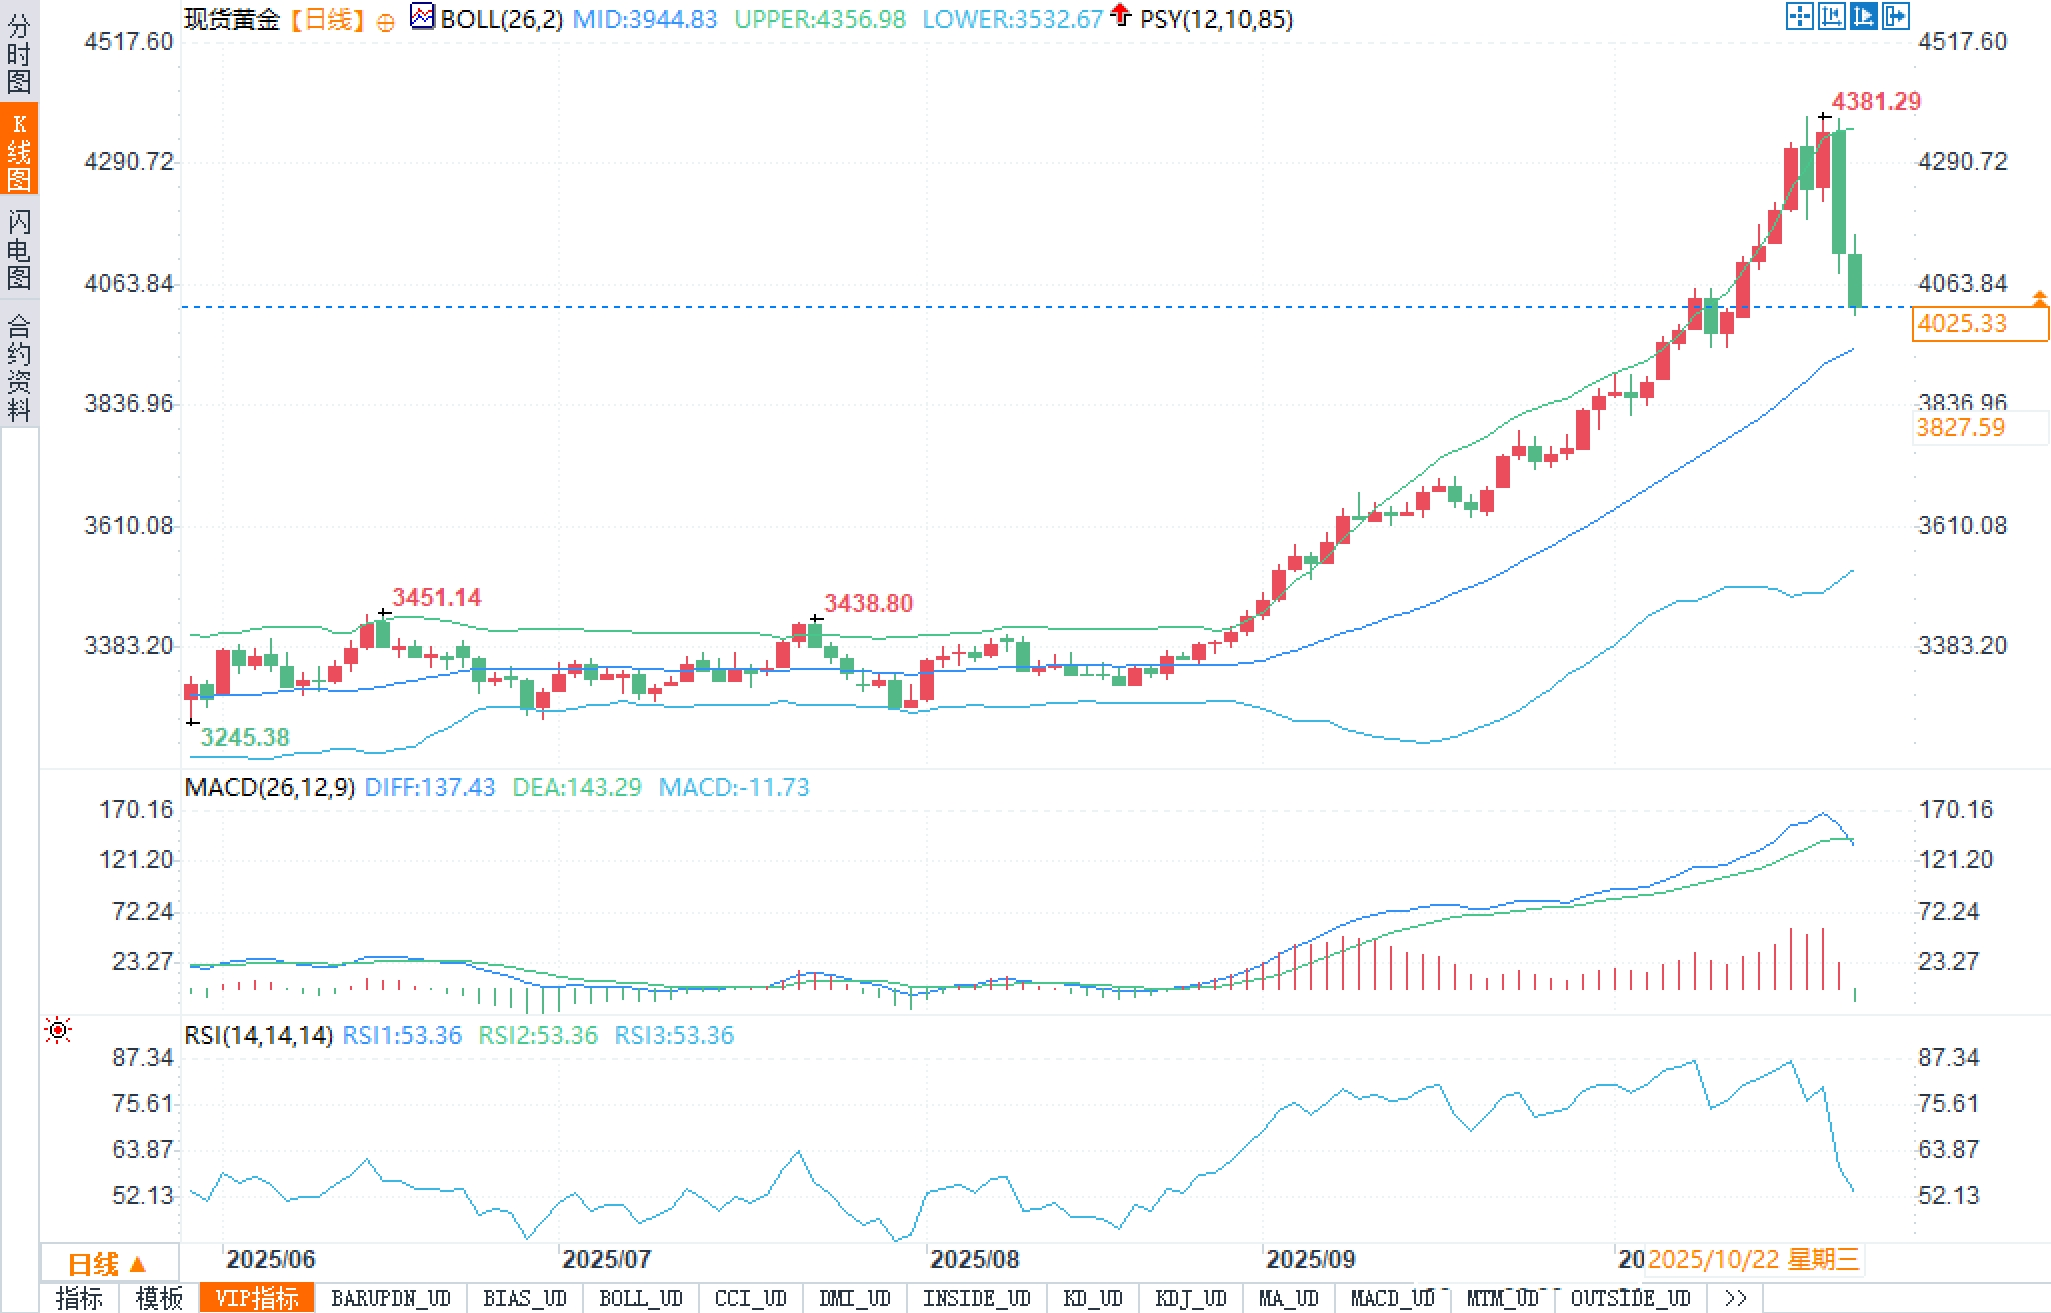
MACD (26, 12, 9) shows DIFF at 137.43, DEA at 143.29, and a histogram reading of -11.73. Momentum is retreating from its highs, with the initial formation of a "death cross" with DIFF crossing below DEA. This suggests a shift from "unilateral expansion" to "high-level correction." Short-term fluctuations and weakening are possible as the market seeks equilibrium. The RSI is near 53.36, having retreated from the previous overbought range (70–80) to a slightly neutral level. After releasing the overheat, the market is entering a "direction-to-be-determined" state.
From a structural perspective, support levels to watch are: ① the psychological level around 4000; ② dynamic support at the middle Bollinger band at 3944.83; and ③ the previous low concentration area at 3850. Resistance levels are: ① 4100 (short-term bull-short equilibrium level); ② the upper edge at 4356.98; and ③ the period high at 4381.29. If the price re-establishes above 4100 and moves upward with increased volume, a retest of the upward trend is possible. Conversely, a break below 4000 and a significant break below the middle band would point to a retracement window between 3944.83 and 3850, completing a secondary confirmation of the lower edge of the upward channel.
Sentiment has recently shifted from "overheated momentum chasing" to "rationalization after a shock at a high point." The anchoring effect of the previously steep slope has caused a significant portion of investors to develop a "price illusion" around 4381.29, leading them to be reluctant to sell and wait and see during the initial pullback. Subsequently, after breaking through key short-term levels, they resorted to passive profit-taking, amplifying volatility. The "price magnetism" of the 4,000 mark has led to diverging sentiment: trend-setting funds on the right await confirmation of a re-establishment above 4100, while speculative funds on the left are testing the market around 4000, resulting in a zigzag pattern of "pull-up, pull-back, and retest."
From a contrarian perspective, a rapid cooling of sentiment is often necessary to consolidate before a trend continues. If the risk-off theme resurfaces or policy turns further dovish, extreme sentiment could first signal a "low-to-high open/long lower shadow" pattern in gold prices. If the US dollar remains strong and real yields stabilize and rise, sentiment could shift to a more conservative framework of "stripping off on rallies and trading in a range."
Short-term (several days to two weeks): The baseline scenario is "high-level volatility - choosing a direction." Below 4100, gold prices are likely to seesaw between 4000 and 4060. A successful close above 4100, accompanied by a positive MACD histogram, would qualify for a retest of 4356.98-4381.29. If it unexpectedly breaks below 4000 and closes below the middle Bollinger band (3944.83) on the daily chart, a short-term retracement target would be 3850, representing a secondary cooling of the previous rally.
Key triggers for long-short divergences:
1) Data and policies: If CPI and PMI are weaker than expected and reinforce the Fed’s outlook for rate cuts, it will be bullish for precious metals; if inflation stickiness exceeds expectations, it will be bearish.
2) Yield curve: Directional changes in long-term nominal and real interest rates will directly affect the discount factor of gold.
3) Foreign exchange resonance: The strength of the US dollar and the safe-haven properties of the Japanese yen and Swiss franc increase and decrease, which is an "accelerator" of gold price fluctuations.
4) Geopolitics and Finance: The extension of the US government shutdown and the temporary increase in geopolitical uncertainty may lead to a redistribution of safe-haven premiums.
Conclusion: This pullback is more of a healthy cooling of previously overheated momentum. As long as the support band of 4000-3944.83 remains intact on the weekly chart, the bullish outlook for the medium term and short-term oscillation remains unchanged. The first step on the upward path is to recapture 4100 and restore momentum indicators before challenging the strong resistance band of 4356.98-4381.29. In this era of coexisting risks and uncertainties, prices will continue to seek a new equilibrium between policy expectations, risk appetite, and technical equilibrium.
Fundamentals:
The direct drivers of gold's short-term weakness remain the strengthening US dollar and a temporary recovery in risk appetite. A stronger dollar has increased holding costs, dampening overseas buying. Meanwhile, US Treasury yields have remained subdued, providing a buffer for non-interest-bearing assets and preventing further declines.
The $4,000 mark, a significant psychological barrier, attracted dip-hunting and tentative entry from left-side investors. While covering buying drove the intraday rebound, its strength was limited, indicating that the upward momentum was still being digested after the pullback from the highs. Technical overheating following a continuous rise from highs was one of the internal factors of this pullback: the previous period of steep upward slope, momentum indicators accumulated to extreme levels, and profit-taking triggered a typical mean-reversion process of "rapid rise and fall."
On the external macroeconomic front, expectations of tariff-related tensions have cooled temporarily, safe-haven demand has retreated marginally, and gold's traditional "crisis premium" has been released. Meanwhile, fiscal uncertainty persists: the US government shutdown, now stretching into its 22nd day, continues to erode economic activity and confidence. The conflicting forces on safe-haven sentiment and the US dollar are creating a short-term tug-of-war.
Regarding forward-looking data, this week's US inflation (CPI) and the preliminary October Purchasing Managers' Index will be in focus. Market expectations are converging on a modest 25 basis point rate cut at the Federal Reserve's October 29-30 meeting. If both month-over-month inflation and core inflation readings continue to weaken, this will further solidify the "moderately dovish" policy stance. A sticky upward trend will dampen the resilience of precious metals. Overall, declining policy uncertainty has an asymmetric impact on gold: if a dovish stance materializes, nominal and real yields will decline, positive for gold prices. If inflation unexpectedly strengthens, a rise in the US dollar and yields will weigh on gold prices.
Central bank gold purchases and geopolitical uncertainty remain key pillars of the medium- to long-term bottoming logic. Even if short-term indicators of congestion and overheating pull back, structural allocation forces remain, maintaining a bottoming logic for bulls that the market will not fall too far.
Technical aspects:
The daily chart shows a clear opening of the Bollinger Bands: upper band 4356.98, lower band 3532.67, and middle band 3944.83. The price is currently trading in the upper half of the range, above the middle band and below the upper band, indicating that the medium-term uptrend has not been broken, but the acceleration has slowed. The previous high of 4381.29 constitutes a temporary "supply concentration zone," while 4100 has been a key watershed in the past two days. The price has repeatedly tested this level but failed to hold, turning it into a short-term resistance level.
MACD (26, 12, 9) shows DIFF at 137.43, DEA at 143.29, and a histogram reading of -11.73. Momentum is retreating from its highs, with the initial formation of a "death cross" with DIFF crossing below DEA. This suggests a shift from "unilateral expansion" to "high-level correction." Short-term fluctuations and weakening are possible as the market seeks equilibrium. The RSI is near 53.36, having retreated from the previous overbought range (70–80) to a slightly neutral level. After releasing the overheat, the market is entering a "direction-to-be-determined" state.
From a structural perspective, support levels to watch are: ① the psychological level around 4000; ② dynamic support at the middle Bollinger band at 3944.83; and ③ the previous low concentration area at 3850. Resistance levels are: ① 4100 (short-term bull-short equilibrium level); ② the upper edge at 4356.98; and ③ the period high at 4381.29. If the price re-establishes above 4100 and moves upward with increased volume, a retest of the upward trend is possible. Conversely, a break below 4000 and a significant break below the middle band would point to a retracement window between 3944.83 and 3850, completing a secondary confirmation of the lower edge of the upward channel.
Market sentiment observation:
Sentiment has recently shifted from "overheated momentum chasing" to "rationalization after a shock at a high point." The anchoring effect of the previously steep slope has caused a significant portion of investors to develop a "price illusion" around 4381.29, leading them to be reluctant to sell and wait and see during the initial pullback. Subsequently, after breaking through key short-term levels, they resorted to passive profit-taking, amplifying volatility. The "price magnetism" of the 4,000 mark has led to diverging sentiment: trend-setting funds on the right await confirmation of a re-establishment above 4100, while speculative funds on the left are testing the market around 4000, resulting in a zigzag pattern of "pull-up, pull-back, and retest."
From a contrarian perspective, a rapid cooling of sentiment is often necessary to consolidate before a trend continues. If the risk-off theme resurfaces or policy turns further dovish, extreme sentiment could first signal a "low-to-high open/long lower shadow" pattern in gold prices. If the US dollar remains strong and real yields stabilize and rise, sentiment could shift to a more conservative framework of "stripping off on rallies and trading in a range."
Market outlook:
Short-term (several days to two weeks): The baseline scenario is "high-level volatility - choosing a direction." Below 4100, gold prices are likely to seesaw between 4000 and 4060. A successful close above 4100, accompanied by a positive MACD histogram, would qualify for a retest of 4356.98-4381.29. If it unexpectedly breaks below 4000 and closes below the middle Bollinger band (3944.83) on the daily chart, a short-term retracement target would be 3850, representing a secondary cooling of the previous rally.
Key triggers for long-short divergences:
1) Data and policies: If CPI and PMI are weaker than expected and reinforce the Fed’s outlook for rate cuts, it will be bullish for precious metals; if inflation stickiness exceeds expectations, it will be bearish.
2) Yield curve: Directional changes in long-term nominal and real interest rates will directly affect the discount factor of gold.
3) Foreign exchange resonance: The strength of the US dollar and the safe-haven properties of the Japanese yen and Swiss franc increase and decrease, which is an "accelerator" of gold price fluctuations.
4) Geopolitics and Finance: The extension of the US government shutdown and the temporary increase in geopolitical uncertainty may lead to a redistribution of safe-haven premiums.
Conclusion: This pullback is more of a healthy cooling of previously overheated momentum. As long as the support band of 4000-3944.83 remains intact on the weekly chart, the bullish outlook for the medium term and short-term oscillation remains unchanged. The first step on the upward path is to recapture 4100 and restore momentum indicators before challenging the strong resistance band of 4356.98-4381.29. In this era of coexisting risks and uncertainties, prices will continue to seek a new equilibrium between policy expectations, risk appetite, and technical equilibrium.
- Risk Warning and Disclaimer
- The market involves risk, and trading may not be suitable for all investors. This article is for reference only and does not constitute personal investment advice, nor does it take into account certain users’ specific investment objectives, financial situation, or other needs. Any investment decisions made based on this information are at your own risk.