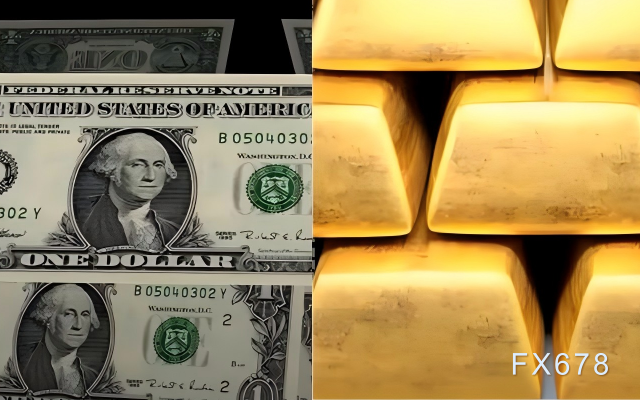
Gold's 4020 defense line is in crisis! In the "calm eye of the storm" of US debt, the US dollar is brewing the next round of surprise attack!
2025-10-22 20:38:08
On Wednesday (October 22nd, Beijing time), the U.S. Treasury market continued its mild bull market flattening pattern. The 10-year yield fell slightly to 3.950%, down 0.35% on the day. This indicates that investors are further bringing forward their expectations for the end of quantitative tightening (QT), injecting a hint of cautious optimism into the entire fixed income sector. The U.S. dollar index rose slightly by 0.07% to 99.0329, remaining above the middle Bollinger Band, reflecting its relative resilience amid the recovery in risk appetite. Meanwhile, spot gold prices plummeted to $4,040.54 per ounce, a 2.04% drop on the day and a nearly 9% decline from its recent high. This sharp correction highlights the vulnerability of safe-haven assets to bond market signals. Overall, the market is experiencing a data vacuum. Due to the government shutdown, Wednesday's economic calendar was light, with only a few Treasury auctions and repo operations supporting liquidity. However, global macro events, such as the unexpected softening of UK inflation, have quietly amplified cross-market linkages. In the short term, the low volatility range of U.S. Treasury bonds will become an anchor point for the U.S. dollar and gold trends, which deserves close attention from traders.
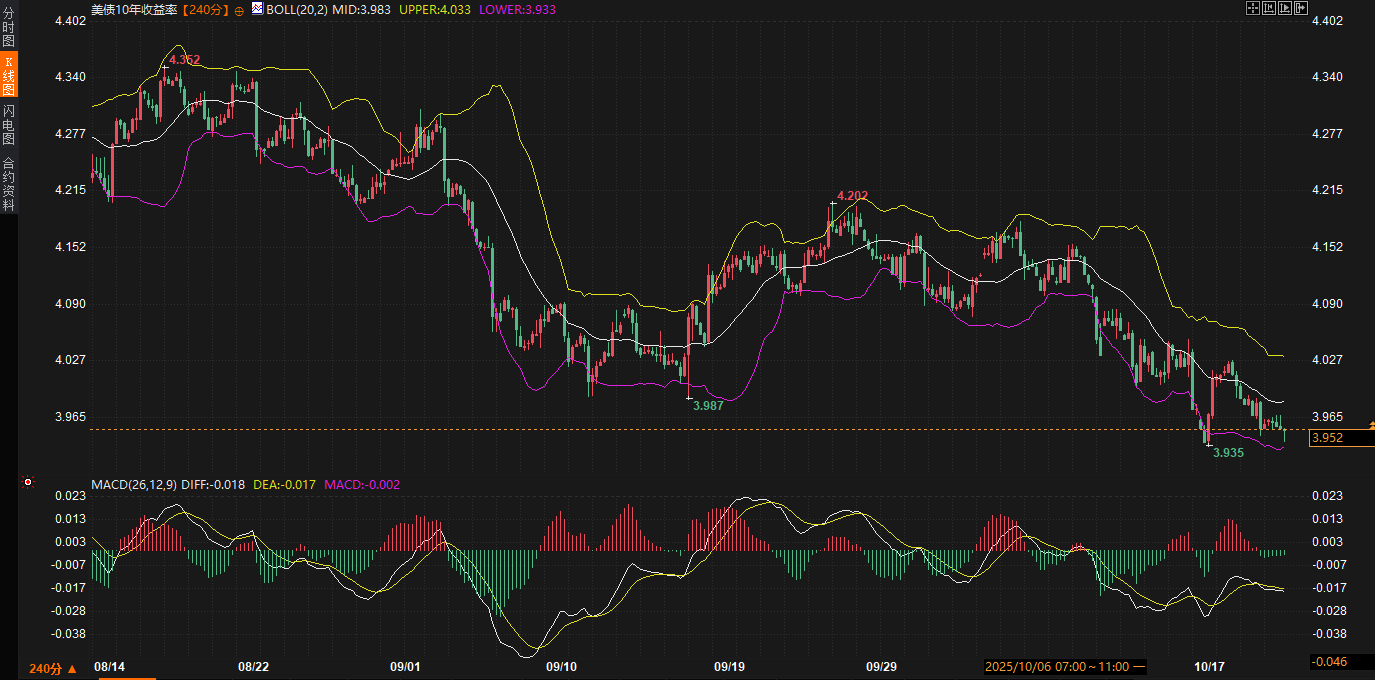
The core narrative in the U.S. Treasury market remains centered around the flattening of the yield curve, a trend that continued on Wednesday, with the 5-year/30-year yield spread narrowing to 97 basis points, a full 25 basis points from its September high. This bullish flattening is not a sudden development, but rather a collective adjustment by investors to the Fed's QT schedule. Several institutions have shifted the end of QT forward, easing supply pressures and providing fundamental support for the downward trend in yields. The 10-year yield is currently hovering at 3.950%, just shy of its recent low of 3.936%. The Bollinger Band (20,2) indicator shows a relatively tight range with a middle band of 3.983, an upper band of 4.033, and a lower band of 3.933, suggesting a lack of near-term breakout momentum.
From a technical perspective, the MACD (26, 12, 9) indicator's DIFF value is -0.018, and the DEA value is -0.017. The slightly negative histogram suggests that while downward momentum exists, it has yet to build to a significant divergence. This corresponds to the intraday's 0.35% pullback. The yield curve is fluctuating at a low level, reflecting the market's wait-and-see attitude ahead of the upcoming CPI data. Friday's CPI report will be a key catalyst, but until then, the trading range is expected to remain between 3.97% and 3.94%, possibly even testing the lower limit of 3.93%. From a fundamental perspective, Wednesday's Treasury auction schedule, while light, is not to be underestimated: a $13 billion 20-year bond auction will resume at 1:00 PM, followed by a $4 billion 2-3 year note repo operation at 2:00 PM. While these liquidity events are limited in scale, they can provide subtle clues to yield anchoring amidst the data gap caused by the government shutdown.
It's worth noting that the rebalancing of global central bank holdings is quietly impacting the U.S. Treasury ecosystem. Reputable analysts point out that central banks are overweight in gold and relatively underweight in the U.S. dollar, further strengthening the appeal of U.S. Treasuries as a global reserve asset. Against this backdrop, the return of American exceptionalism—economic resilience and policy independence—is gradually subverting traditional central bank strategies. UK inflation data for September confirmed this transmission: the CPI remained flat at 3.8%, the core CPI fell to 3.5%, and the services CPI remained stable at 4.7%. This unexpected weakness directly triggered a sharp drop of over 10 basis points in UK bond yields and pushed the probability of a Bank of England rate cut by the end of the year to over 70%. This not only widened the transatlantic interest rate differential but also indirectly benefited the relative value of U.S. Treasuries, reinforcing the logic of stabilizing low yields. Traders should note that while this external signal hasn't directly impacted U.S. Treasuries, it is quietly reshaping short-term expectations through the flattening curve.
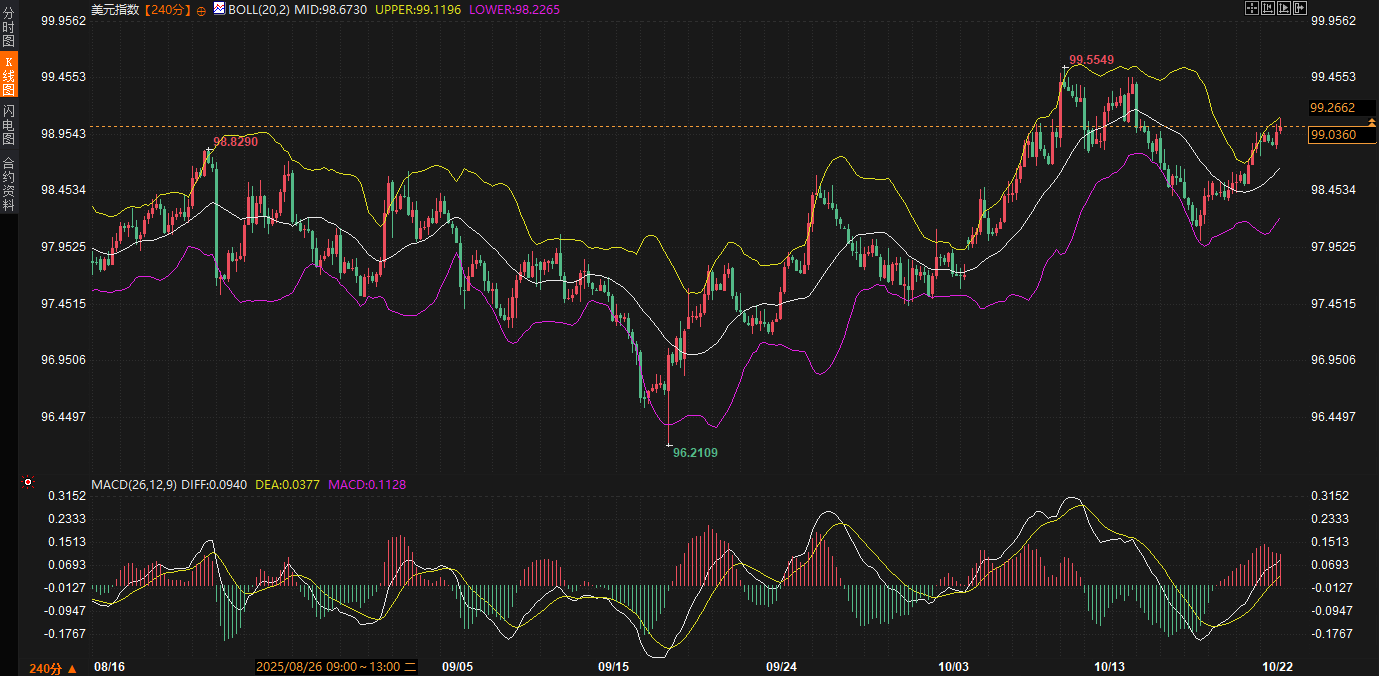
The slight rise in the US dollar index wasn't isolated; it was a direct product of the decline in US Treasury yields and the rebound in global risk appetite. From a bond market perspective, the 0.35% intraday decline in the 10-year yield directly eased pressure on US dollar funding costs, pushing the index to a firm footing at 99.0329. This transmission mechanism is vividly demonstrated on the 240-minute chart: the middle Bollinger Band at 99.0712 has become immediate support. While the gap between the upper band at 99.5227 and the lower band at 98.6197 is wide, the index is currently trading firmly above the middle band, indicating a moderate bullish bias. The MACD indicator's DIFF of 0.1637 is slightly below the DEA of 0.1934. While the bar chart is slightly negative, it is generally hovering above the zero axis, suggesting neutral to strong short-term momentum, avoiding the risk of a sharp drop.
Among fundamental drivers, the bond market's support for the US dollar is particularly crucial. Investors' anticipated end of the QT (Quarterly Treasuries) has not only reduced supply pressure on US Treasuries but also strengthened the dollar's position as a safe-haven currency. Recent outlooks from prominent institutions emphasize that the US dollar remains resilient amid the risk-averse environment triggered by trade frictions, and its strength since the beginning of the autumn has been recognized by the market. This is highly correlated with the euro's trajectory against the US dollar: if it falls below the key level of 1.1660, the euro could further decline into the 1.15-1.14 range, followed by a slight rebound to 1.17, ultimately targeting 1.08 by 2026. This expectation is not groundless, but stems from a cascade of bond market signals: low and volatile yields reduce the appeal of dollar short positions, especially as central banks begin to review their long gold positions.
Technical analysis further supports the dollar's range-bound resilience. While the intraday gain of 0.07% was small, it remained firmly within the middle Bollinger Band, with minimal trading volume, suggesting that both bulls and bears are testing the waters amidst low volatility. If yields continue to converge within the 3.93%-4% range, the US Dollar Index is expected to test resistance near 99.50, avoiding a break below the lower Bollinger Band of 98.62 in the short term. From a trader's perspective, the stability of the bond market-dollar linkage provides a rare sense of "anchoring": during a data vacuum, any external disturbances—such as the spillover effects of UK inflation—are likely to further consolidate the dollar's relative strength through interest rate differentials, rather than triggering sharp fluctuations. Overall, the low yield environment for US Treasuries is instilling a sense of resilience in the dollar, ensuring it maintains upside potential amidst range-bound fluctuations over the coming days.
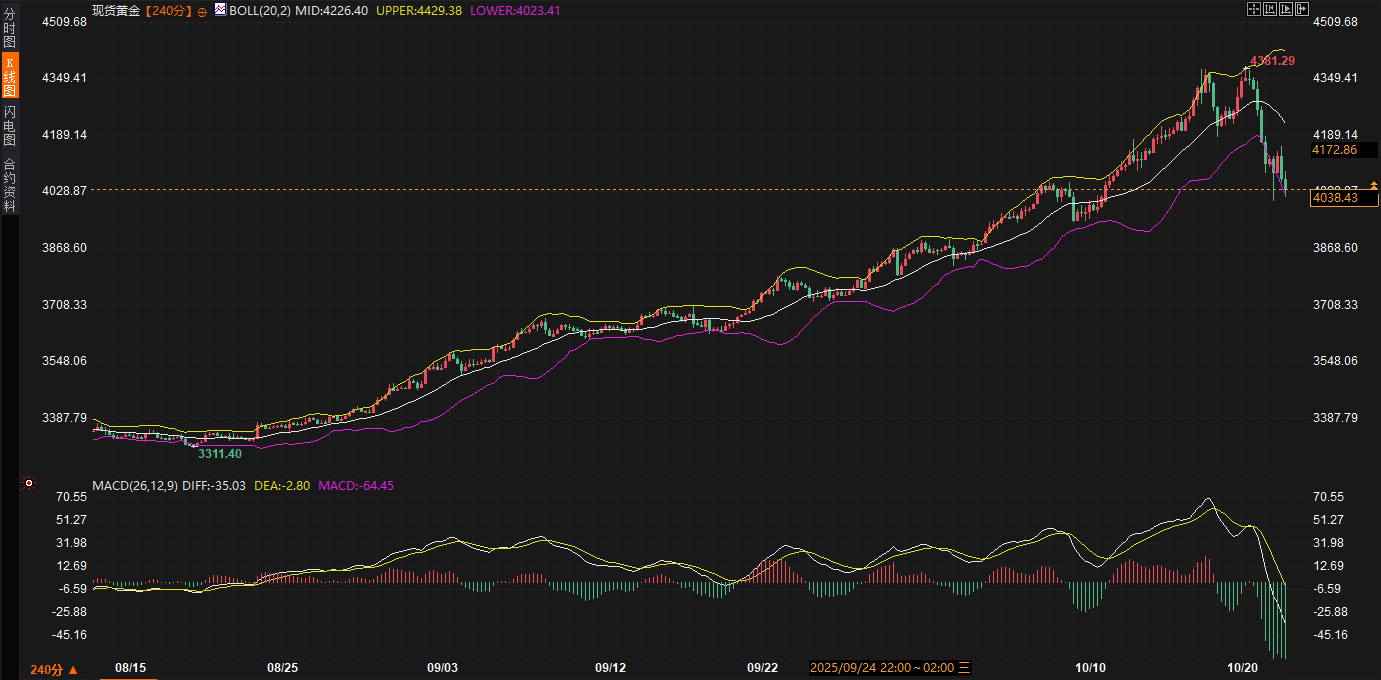
Another focal point of Wednesday's market was the sharp decline in spot gold, which has fallen 9% from its recent high, directly dragging prices to around $4,040.54 per ounce. This decline significantly outpaced the dollar's slight fluctuations during the same period, highlighting the inverse transmission of bond market signals to the risk-off effect. Unlike the traditional negative correlation between the dollar and gold, this correction is more due to the "crowding out" effect of low bond yields. With the 10-year yield holding at a low 3.95%, investors' optimistic expectations for the end of the QT weakened gold's appeal as a non-yielding asset, leading to an accelerated liquidation of long positions. On the 240-minute chart, the middle Bollinger Band at 4,226.47 has become a distant resistance level, while the upper band at 4,429.23 appears even more illusory, while the lower band at 4,023.76 is within reach. The 2.04% intraday drop in price is testing this lower support level.
The MACD indicator's DIFF of -34.90 and DEA of -2.79 formed a significant negative divergence, with the histogram deeply below the zero axis, indicating clear signs of weakening momentum. This trend is highly consistent with the flattening trend in the bond market. The narrowing yield curve not only compresses inflation premium expectations but also amplifies selling pressure on gold through adjustments in central bank holdings. Leading institutions have pointed out that central banks' long positions in gold are "overextended," while the relative shortage of the US dollar is driving a wave of profit-taking. Looking back at the recent USD-gold trading logic, since the October 14th outlook, gold's "inverse trade" pillar is facing collapse: the media's earlier pessimistic narrative of a weakening dollar has been refuted by reality, and the recovery of the US Treasury market has further undermined gold's safe-haven narrative.
From a fundamental perspective, this reversal of risk aversion, channeled through the bond market, is particularly subtle. While weakening UK inflation has provided a short-term boost to UK government bonds, the relative safety of US Treasuries has re-emphasized from the perspective of global central banks, and gold's position as a "last resort" is shaky. Institutional predictions suggest that gold may further target the $3,500 breakout level. This isn't idle talk, but rather based on the stable extension of the bond market range. If yields remain range-bound between 3.93% and 3.97%, safe-haven flows from gold to US Treasuries will accelerate, amplifying the downward trend. Technically, the price has fallen below the key mid-line level of 4226.47, and may find a near-term bottom near 4023.76. However, the negative MACD indicates increased risk. Without external geopolitical disruptions, such as a sudden escalation in the Russia-Ukraine situation, gold's rebound momentum will be limited.
From a trader's perspective, this reversal of the bond market-led risk-off effect provides a window for cautious observation: gold's correction is not isolated, but rather mirrors the stabilization of low US Treasury yields. While intraday trading volume hasn't been extremely high, signs of a bullish exit have emerged. Combined with the structural imbalances in central bank holdings, gold is likely to continue consolidating near the lower Bollinger Band in the short term, awaiting further guidance from Friday's CPI.
Looking ahead to the next two to three days, US Treasury yields are expected to remain within a narrow range of 3.93%-3.97%. The anticipated early end of QT will provide a downside buffer, but a potential surprise in Friday's CPI could trigger a brief upward test. The US dollar index, benefiting from this bond market anchor, is expected to fluctuate modestly between 99.00 and 99.50. The stability of the MACD above the zero axis prevents a break below 98.62. Regarding gold, the reverse transmission of the bond market's risk-off effect will dominate the market, and prices may further test support near $4,020. If yields remain low, the path to the $3,500 target will become increasingly clear. However, in the short term, the Bollinger Bands range of 4,023-4,226 may become a focal point for bullish and bearish tug-of-war.
US Treasury dynamics: QT expectations advanced and yield range narrowed
The core narrative in the U.S. Treasury market remains centered around the flattening of the yield curve, a trend that continued on Wednesday, with the 5-year/30-year yield spread narrowing to 97 basis points, a full 25 basis points from its September high. This bullish flattening is not a sudden development, but rather a collective adjustment by investors to the Fed's QT schedule. Several institutions have shifted the end of QT forward, easing supply pressures and providing fundamental support for the downward trend in yields. The 10-year yield is currently hovering at 3.950%, just shy of its recent low of 3.936%. The Bollinger Band (20,2) indicator shows a relatively tight range with a middle band of 3.983, an upper band of 4.033, and a lower band of 3.933, suggesting a lack of near-term breakout momentum.
From a technical perspective, the MACD (26, 12, 9) indicator's DIFF value is -0.018, and the DEA value is -0.017. The slightly negative histogram suggests that while downward momentum exists, it has yet to build to a significant divergence. This corresponds to the intraday's 0.35% pullback. The yield curve is fluctuating at a low level, reflecting the market's wait-and-see attitude ahead of the upcoming CPI data. Friday's CPI report will be a key catalyst, but until then, the trading range is expected to remain between 3.97% and 3.94%, possibly even testing the lower limit of 3.93%. From a fundamental perspective, Wednesday's Treasury auction schedule, while light, is not to be underestimated: a $13 billion 20-year bond auction will resume at 1:00 PM, followed by a $4 billion 2-3 year note repo operation at 2:00 PM. While these liquidity events are limited in scale, they can provide subtle clues to yield anchoring amidst the data gap caused by the government shutdown.
It's worth noting that the rebalancing of global central bank holdings is quietly impacting the U.S. Treasury ecosystem. Reputable analysts point out that central banks are overweight in gold and relatively underweight in the U.S. dollar, further strengthening the appeal of U.S. Treasuries as a global reserve asset. Against this backdrop, the return of American exceptionalism—economic resilience and policy independence—is gradually subverting traditional central bank strategies. UK inflation data for September confirmed this transmission: the CPI remained flat at 3.8%, the core CPI fell to 3.5%, and the services CPI remained stable at 4.7%. This unexpected weakness directly triggered a sharp drop of over 10 basis points in UK bond yields and pushed the probability of a Bank of England rate cut by the end of the year to over 70%. This not only widened the transatlantic interest rate differential but also indirectly benefited the relative value of U.S. Treasuries, reinforcing the logic of stabilizing low yields. Traders should note that while this external signal hasn't directly impacted U.S. Treasuries, it is quietly reshaping short-term expectations through the flattening curve.
US dollar resilience: support transmission under low bond yields
The slight rise in the US dollar index wasn't isolated; it was a direct product of the decline in US Treasury yields and the rebound in global risk appetite. From a bond market perspective, the 0.35% intraday decline in the 10-year yield directly eased pressure on US dollar funding costs, pushing the index to a firm footing at 99.0329. This transmission mechanism is vividly demonstrated on the 240-minute chart: the middle Bollinger Band at 99.0712 has become immediate support. While the gap between the upper band at 99.5227 and the lower band at 98.6197 is wide, the index is currently trading firmly above the middle band, indicating a moderate bullish bias. The MACD indicator's DIFF of 0.1637 is slightly below the DEA of 0.1934. While the bar chart is slightly negative, it is generally hovering above the zero axis, suggesting neutral to strong short-term momentum, avoiding the risk of a sharp drop.
Among fundamental drivers, the bond market's support for the US dollar is particularly crucial. Investors' anticipated end of the QT (Quarterly Treasuries) has not only reduced supply pressure on US Treasuries but also strengthened the dollar's position as a safe-haven currency. Recent outlooks from prominent institutions emphasize that the US dollar remains resilient amid the risk-averse environment triggered by trade frictions, and its strength since the beginning of the autumn has been recognized by the market. This is highly correlated with the euro's trajectory against the US dollar: if it falls below the key level of 1.1660, the euro could further decline into the 1.15-1.14 range, followed by a slight rebound to 1.17, ultimately targeting 1.08 by 2026. This expectation is not groundless, but stems from a cascade of bond market signals: low and volatile yields reduce the appeal of dollar short positions, especially as central banks begin to review their long gold positions.
Technical analysis further supports the dollar's range-bound resilience. While the intraday gain of 0.07% was small, it remained firmly within the middle Bollinger Band, with minimal trading volume, suggesting that both bulls and bears are testing the waters amidst low volatility. If yields continue to converge within the 3.93%-4% range, the US Dollar Index is expected to test resistance near 99.50, avoiding a break below the lower Bollinger Band of 98.62 in the short term. From a trader's perspective, the stability of the bond market-dollar linkage provides a rare sense of "anchoring": during a data vacuum, any external disturbances—such as the spillover effects of UK inflation—are likely to further consolidate the dollar's relative strength through interest rate differentials, rather than triggering sharp fluctuations. Overall, the low yield environment for US Treasuries is instilling a sense of resilience in the dollar, ensuring it maintains upside potential amidst range-bound fluctuations over the coming days.
Gold adjustment: reversal effect of risk aversion transmission in the bond market
Another focal point of Wednesday's market was the sharp decline in spot gold, which has fallen 9% from its recent high, directly dragging prices to around $4,040.54 per ounce. This decline significantly outpaced the dollar's slight fluctuations during the same period, highlighting the inverse transmission of bond market signals to the risk-off effect. Unlike the traditional negative correlation between the dollar and gold, this correction is more due to the "crowding out" effect of low bond yields. With the 10-year yield holding at a low 3.95%, investors' optimistic expectations for the end of the QT weakened gold's appeal as a non-yielding asset, leading to an accelerated liquidation of long positions. On the 240-minute chart, the middle Bollinger Band at 4,226.47 has become a distant resistance level, while the upper band at 4,429.23 appears even more illusory, while the lower band at 4,023.76 is within reach. The 2.04% intraday drop in price is testing this lower support level.
The MACD indicator's DIFF of -34.90 and DEA of -2.79 formed a significant negative divergence, with the histogram deeply below the zero axis, indicating clear signs of weakening momentum. This trend is highly consistent with the flattening trend in the bond market. The narrowing yield curve not only compresses inflation premium expectations but also amplifies selling pressure on gold through adjustments in central bank holdings. Leading institutions have pointed out that central banks' long positions in gold are "overextended," while the relative shortage of the US dollar is driving a wave of profit-taking. Looking back at the recent USD-gold trading logic, since the October 14th outlook, gold's "inverse trade" pillar is facing collapse: the media's earlier pessimistic narrative of a weakening dollar has been refuted by reality, and the recovery of the US Treasury market has further undermined gold's safe-haven narrative.
From a fundamental perspective, this reversal of risk aversion, channeled through the bond market, is particularly subtle. While weakening UK inflation has provided a short-term boost to UK government bonds, the relative safety of US Treasuries has re-emphasized from the perspective of global central banks, and gold's position as a "last resort" is shaky. Institutional predictions suggest that gold may further target the $3,500 breakout level. This isn't idle talk, but rather based on the stable extension of the bond market range. If yields remain range-bound between 3.93% and 3.97%, safe-haven flows from gold to US Treasuries will accelerate, amplifying the downward trend. Technically, the price has fallen below the key mid-line level of 4226.47, and may find a near-term bottom near 4023.76. However, the negative MACD indicates increased risk. Without external geopolitical disruptions, such as a sudden escalation in the Russia-Ukraine situation, gold's rebound momentum will be limited.
From a trader's perspective, this reversal of the bond market-led risk-off effect provides a window for cautious observation: gold's correction is not isolated, but rather mirrors the stabilization of low US Treasury yields. While intraday trading volume hasn't been extremely high, signs of a bullish exit have emerged. Combined with the structural imbalances in central bank holdings, gold is likely to continue consolidating near the lower Bollinger Band in the short term, awaiting further guidance from Friday's CPI.
Short-term outlook: range-bound fluctuations and continuation of the transmission chain
Looking ahead to the next two to three days, US Treasury yields are expected to remain within a narrow range of 3.93%-3.97%. The anticipated early end of QT will provide a downside buffer, but a potential surprise in Friday's CPI could trigger a brief upward test. The US dollar index, benefiting from this bond market anchor, is expected to fluctuate modestly between 99.00 and 99.50. The stability of the MACD above the zero axis prevents a break below 98.62. Regarding gold, the reverse transmission of the bond market's risk-off effect will dominate the market, and prices may further test support near $4,020. If yields remain low, the path to the $3,500 target will become increasingly clear. However, in the short term, the Bollinger Bands range of 4,023-4,226 may become a focal point for bullish and bearish tug-of-war.
- Risk Warning and Disclaimer
- The market involves risk, and trading may not be suitable for all investors. This article is for reference only and does not constitute personal investment advice, nor does it take into account certain users’ specific investment objectives, financial situation, or other needs. Any investment decisions made based on this information are at your own risk.