Gold prices fall on optimism about US-China trade, but Fed rate cut expectations may limit losses
2025-10-27 13:50:53
Gold prices weakened at the start of the week, falling as low as $4,053.81 per ounce in Asian trading on Monday (October 27). However, dip-hunting supported the price, which has since rebounded to around $4,080. Lacking strong follow-through selling pressure, gold prices remained above Friday's swing low during the Asian session. Signs of easing trade tensions between the US and China boosted investor appetite for riskier assets. This was reflected in positive sentiment in global stock markets, which has been a key factor dampening demand for the safe-haven precious metal. However, expectations of a dovish Federal Reserve policy and a modest decline in the US dollar (USD) have cushioned gold's downside.
Investors now appear fully priced in two more Federal Reserve rate cuts this year, a forecast further reinforced by weaker consumer inflation data released last Friday. This, in turn, has kept the US dollar under pressure and should help limit further losses for non-yielding gold. Traders are also likely to avoid a clear direction in the near term, opting to await the outcome of Wednesday's two-day FOMC monetary policy meeting. This outlook will drive the US dollar in the short term and provide significant support for gold price pairs.

Senior economic officials from China and the United States agreed on Sunday on the outlines of a potential trade deal, which will be discussed further when U.S. President Donald Trump and his Chinese counterpart meet later this week. U.S. Treasury Secretary Scott Besant said discussions during the ASEAN summit in Kuala Lumpur removed the threat of 100% tariffs on Chinese imports starting November 1.
This eased investor nerves and reduced concerns about further escalation in trade tensions between the world's two largest economies. Furthermore, this optimism fueled a sharp rally in stock markets at the start of the new week and exerted some downward pressure on safe-haven gold during the Asian session. However, expectations of further interest rate cuts from the Federal Reserve have sounded alarm bells for bears.
The U.S. Bureau of Labor Statistics reported last Friday that the overall consumer price index (CPI) rose 0.3% in September, bringing the annualized rate to 3%. Core inflation, excluding food and energy, showed a monthly increase of 0.2% and an annualized rate of 3%. This reading was below market expectations and reaffirmed expectations that the Federal Reserve will lower borrowing costs later this week.
Furthermore, CME Group's FedWatch tool shows that traders are almost fully pricing in another 25 basis point rate cut in December. This continues to weigh on the US dollar, providing support for gold prices. This, combined with geopolitical risks stemming from the protracted Russia-Ukraine war, has become a key factor supporting non-yielding gold.
Russia launched a drone attack on the Ukrainian capital of Kyiv early Sunday morning. The Ukrainian Air Force said it shot down four of the nine missiles and 90 of the 101 drones launched during the Russian strikes across the country. Furthermore, Russian President Vladimir Putin announced the successful final test of a new nuclear-powered cruise missile, which could provide support for safe-haven commodities.
Traders may also choose to wait and see before the central bank event risk arrives. Meanwhile, the market focus will be on the key FOMC policy decision on Wednesday, which will significantly affect the US dollar price dynamics in the short term and determine the next stage of gold price direction.
Gold would need to fall below $4,000 to warrant a significant correction. From a technical perspective, gold appears to have found support below the 23.6% Fibonacci retracement level of the July-October surge.
However, last week's rebound from near the psychological level of $4,000 and mixed oscillators on the daily chart suggest caution for gold bears.
This suggests that a subsequent break below Friday's swing low (around $4,044) could continue to attract buyers around this level. Next up is the 38.2% Fibonacci retracement level, around $3,950. A decisive break below this level could drag gold prices below $3,900. Further sustained selling could pave the way for a drop towards the 50% retracement level (around $3,810-3,825), potentially touching the 50-day simple moving average (SMA), currently around $3,775.
On the other hand, the Asian session high (around $4109-4110) coincides with the 23.6% Fibonacci retracement support breakout point, which may continue to provide immediate resistance. A sustained upward breakout could push gold prices to the $4155-4160 supply zone. A breakout above this area could trigger short-covering. Gold prices could then accelerate upward, retaking the $4200 mark and climbing further to the next significant resistance level of $4252-4255.
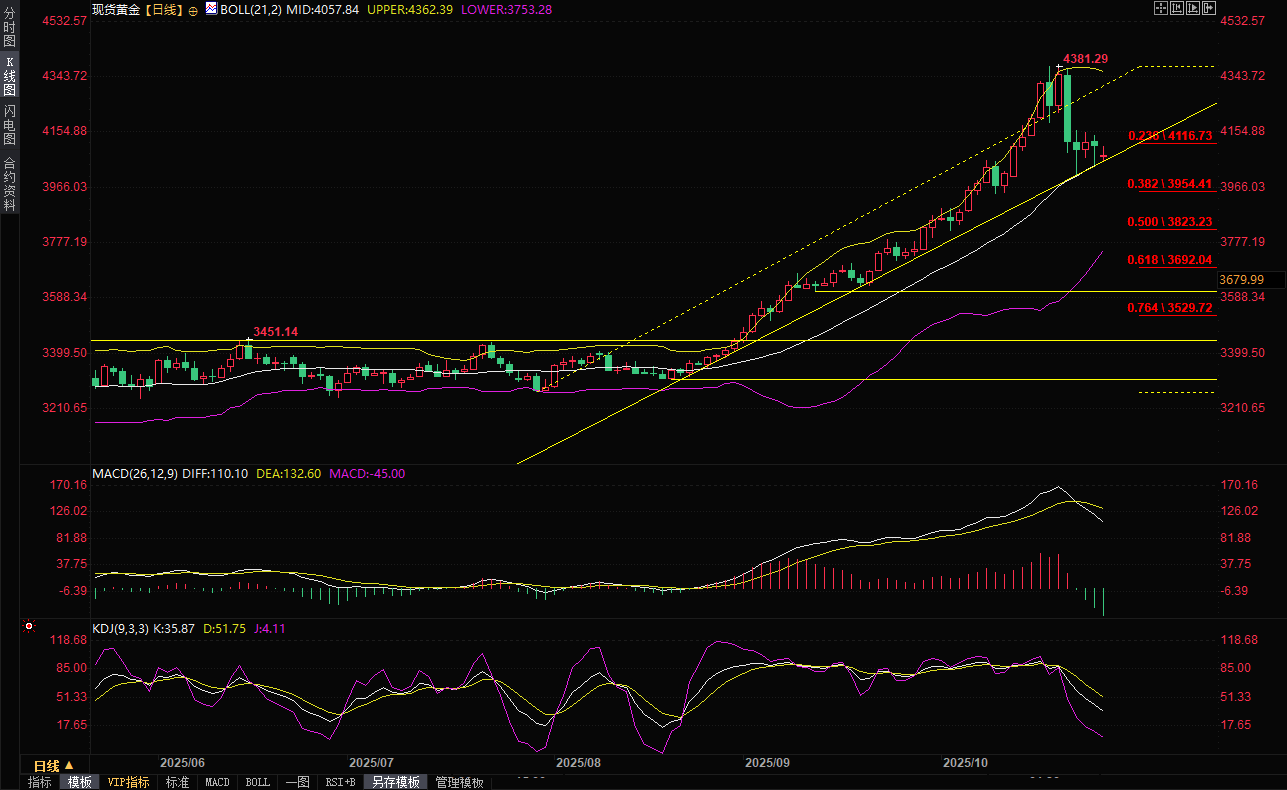
(Spot gold daily chart, source: Yihuitong)
At 13:49 Beijing time, spot gold was trading at $4080.68 per ounce.
Investors now appear fully priced in two more Federal Reserve rate cuts this year, a forecast further reinforced by weaker consumer inflation data released last Friday. This, in turn, has kept the US dollar under pressure and should help limit further losses for non-yielding gold. Traders are also likely to avoid a clear direction in the near term, opting to await the outcome of Wednesday's two-day FOMC monetary policy meeting. This outlook will drive the US dollar in the short term and provide significant support for gold price pairs.
Market Update: Gold bulls remain on the defensive as safe-haven demand weakens
Senior economic officials from China and the United States agreed on Sunday on the outlines of a potential trade deal, which will be discussed further when U.S. President Donald Trump and his Chinese counterpart meet later this week. U.S. Treasury Secretary Scott Besant said discussions during the ASEAN summit in Kuala Lumpur removed the threat of 100% tariffs on Chinese imports starting November 1.
This eased investor nerves and reduced concerns about further escalation in trade tensions between the world's two largest economies. Furthermore, this optimism fueled a sharp rally in stock markets at the start of the new week and exerted some downward pressure on safe-haven gold during the Asian session. However, expectations of further interest rate cuts from the Federal Reserve have sounded alarm bells for bears.
The U.S. Bureau of Labor Statistics reported last Friday that the overall consumer price index (CPI) rose 0.3% in September, bringing the annualized rate to 3%. Core inflation, excluding food and energy, showed a monthly increase of 0.2% and an annualized rate of 3%. This reading was below market expectations and reaffirmed expectations that the Federal Reserve will lower borrowing costs later this week.
Furthermore, CME Group's FedWatch tool shows that traders are almost fully pricing in another 25 basis point rate cut in December. This continues to weigh on the US dollar, providing support for gold prices. This, combined with geopolitical risks stemming from the protracted Russia-Ukraine war, has become a key factor supporting non-yielding gold.
Russia launched a drone attack on the Ukrainian capital of Kyiv early Sunday morning. The Ukrainian Air Force said it shot down four of the nine missiles and 90 of the 101 drones launched during the Russian strikes across the country. Furthermore, Russian President Vladimir Putin announced the successful final test of a new nuclear-powered cruise missile, which could provide support for safe-haven commodities.
Traders may also choose to wait and see before the central bank event risk arrives. Meanwhile, the market focus will be on the key FOMC policy decision on Wednesday, which will significantly affect the US dollar price dynamics in the short term and determine the next stage of gold price direction.
Technical analysis:
Gold would need to fall below $4,000 to warrant a significant correction. From a technical perspective, gold appears to have found support below the 23.6% Fibonacci retracement level of the July-October surge.
However, last week's rebound from near the psychological level of $4,000 and mixed oscillators on the daily chart suggest caution for gold bears.
This suggests that a subsequent break below Friday's swing low (around $4,044) could continue to attract buyers around this level. Next up is the 38.2% Fibonacci retracement level, around $3,950. A decisive break below this level could drag gold prices below $3,900. Further sustained selling could pave the way for a drop towards the 50% retracement level (around $3,810-3,825), potentially touching the 50-day simple moving average (SMA), currently around $3,775.
On the other hand, the Asian session high (around $4109-4110) coincides with the 23.6% Fibonacci retracement support breakout point, which may continue to provide immediate resistance. A sustained upward breakout could push gold prices to the $4155-4160 supply zone. A breakout above this area could trigger short-covering. Gold prices could then accelerate upward, retaking the $4200 mark and climbing further to the next significant resistance level of $4252-4255.
(Spot gold daily chart, source: Yihuitong)
At 13:49 Beijing time, spot gold was trading at $4080.68 per ounce.
- Risk Warning and Disclaimer
- The market involves risk, and trading may not be suitable for all investors. This article is for reference only and does not constitute personal investment advice, nor does it take into account certain users’ specific investment objectives, financial situation, or other needs. Any investment decisions made based on this information are at your own risk.