The market is "betraying" the Fed! US Treasury bonds are turning against the dollar, and the hidden war between gold and the dollar is escalating.
2025-10-27 18:41:38
On Monday (October 27), U.S. Treasury yields, Treasury bonds, and the spot gold market showed clear signs of rotation. The 10-year Treasury yield index re-crossed the 4% mark, reflecting a subtle adjustment in market expectations for a Federal Reserve rate cut this week. Meanwhile, the U.S. dollar index hovered around 98.7860, down 0.14% on the day, indicating a temporary outflow of safe-haven funds. Spot gold, on the other hand, came under downward pressure, experiencing increased intraday volatility.

Overall, with the Federal Reserve's policy meeting approaching, delayed labor market data and repercussions from trade frictions have driven a short-term divergence between the bond and foreign exchange markets. Analysts at prominent institutions point to this divergence as unexpectedly mild inflation data, while potential geopolitical risks and political noise continue to influence capital flows in the periphery. Close attention should be paid to the Fed's signals this week, as they will directly amplify the transmission effect on the bond market.
The bond market's focus this week is undoubtedly on the Federal Reserve's decision. Markets generally expect the Fed to implement a 0.25 percentage point rate cut at its Wednesday meeting, bringing the policy rate range to 3.75%-4.00%. This would be the second such move this year and is intended to mitigate any further signs of a cooling labor market. Rising unemployment insurance claims suggest continued weakness in demand. While the government shutdown has delayed the release of most official statistics (such as the 4.3% unemployment rate in August), this has not weakened the consensus on easing. More importantly, the phrase "additional adjustments" embedded in last month's meeting statement was specifically emphasized by Fed Vice Chairman Michelle Bowman as a foreshadowing of future rate cuts. Analysts believe the Fed will be reluctant to change this wording to avoid prematurely signaling a dovish stance.
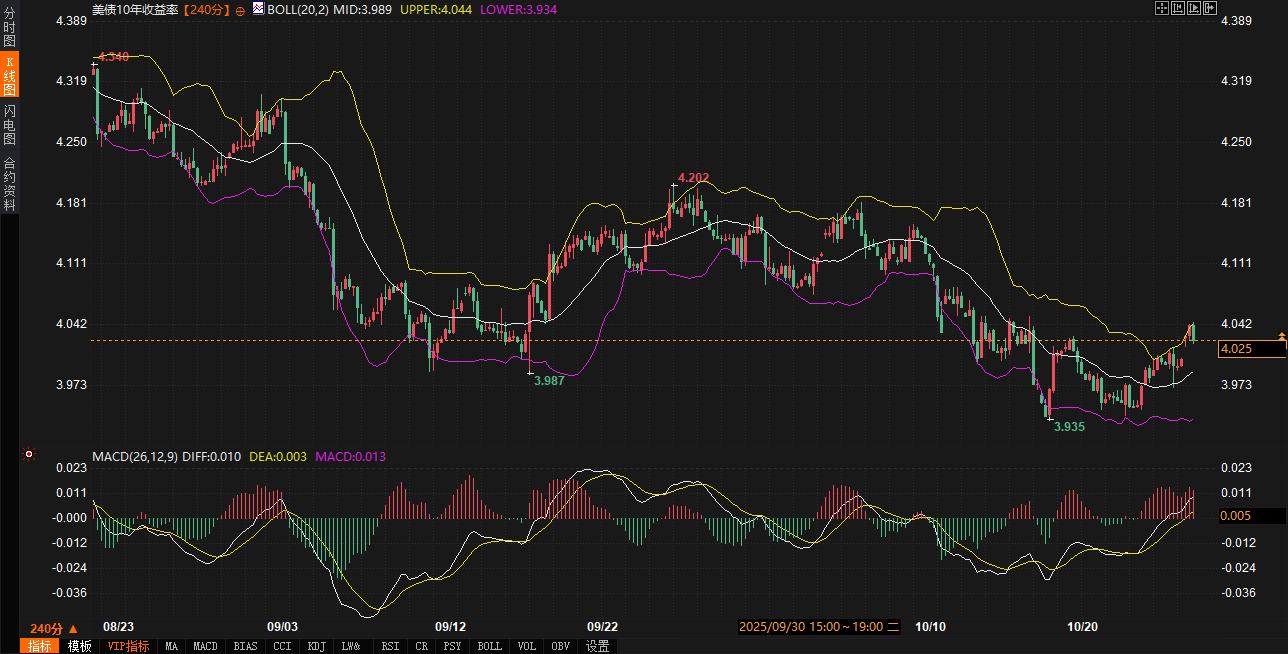
However, the intraday rebound in bond yields exposed internal divisions. The 10-year Treasury yield rebounded from the middle band of 3.989 to 4.025, approaching the upper Bollinger Band limit of 4.044, while the lower band of 3.934 provided short-term support. The MACD indicator showed a DIFF of 0.010 and a DEA of 0.003, with the histogram slightly turning positive near -0.007, suggesting a shift in short-term momentum from downside to a neutral to bullish stance. This echoed overnight headlines: Trump's trade agreement with Southeast Asian countries (such as Malaysia, Cambodia, Thailand, and Vietnam), which included tariff exemptions on some products in exchange for US purchase commitments, eased some trade uncertainty but also triggered a re-examination of the inflation path. The consumer price index rose to a lower-than-expected 3% annual rate in September, which should have reinforced expectations of a rate cut, but the aftermath of the tariff rhetoric has altered this outlook. Economists from well-known institutions have observed that cautious voices are growing within the Federal Reserve about further easing, with many policymakers worried that inflation will remain above the 2% target for a long time. Newly added board member Stephen Milan may dissent again this week and support a larger rate cut of 0.50%.
From a fundamental perspective, upward pressure on the bond market also stems from external events. Amidst low oil prices, Washington has intensified sanctions on Russia and Ukraine. While targeting two major Moscow energy producers hasn't directly impacted the bond market, it has reinforced the narrative of global oversupply and further depressed inflation premium expectations. Argentinian President Javier Milley's election victory has also injected a sliver of reform optimism into emerging markets, but the direct impact on US Treasuries has been limited. Technically, the slope of the 2-year and 10-year yield curves has narrowed from 52.2 basis points to a range of 49.9-53.1, while the 5-year to 30-year yield curves have fluctuated between 97.7-99.1, showing initial signs of overall curve flattening, which often signals a critical point in policy shifts. Watch out for durable goods orders data (expected to show a +0.5% month-over-month reading) and the Dallas Fed Texas Manufacturing Index (previous reading -8.7) due later on Monday; any surprises could further push the yield curve higher.
The bond market saw brisk intraday trading, with TYZ25 contracts reaching 279,000, above the recent average. Block trading was currently unavailable, but the $26 billion six-month bill auction and $69 billion two-year note tender at 11:30 will test the market's appetite for short-term yields. The $86 billion 13-week Treasury bill auction and $70 billion five-year note auction at 1:00 PM could exacerbate long-term volatility. Overall, the rebound in US Treasury yields is not isolated, but rather a prelude to a shift in the Federal Reserve's communication strategy. Institutions expect this week's meeting to discuss the timing of ending quantitative tightening (QT), possibly starting within the month. This will provide a downward buffer for yields, but political pressure (such as the Trump campaign's public calls for low interest rates) may maintain upward momentum in the short term.
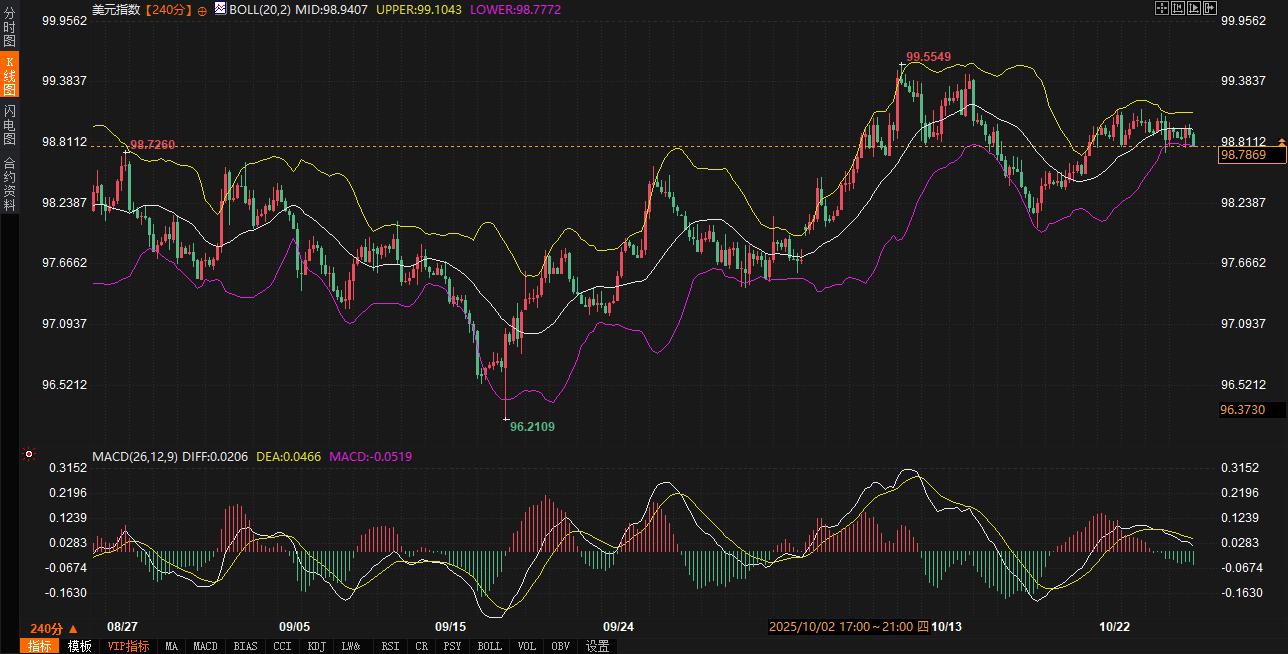
The slight intraday decline in the US dollar index contrasts sharply with the rebound in bond yields, a typical manifestation of the bond-exchange rate linkage. On the 240-minute chart, the US dollar index is trading at 98.7860. The middle Bollinger Band at 98.9408 provides resistance, while the upper band at 99.1040 remains untouched. The lower band at 98.7777 has become immediate support. The MACD indicator's DIFF is 0.0208, the DEA at 0.0466, and the histogram at -0.0517 indicate that while downward momentum has slowed, it has not reversed, suggesting the index is on the verge of a rebound from the lower band. Expectations of a Fed rate cut should have supported the dollar's relative strength, but delayed labor market data and optimism about a trade deal have prompted an outflow of funds from US dollar assets into equities and commodities.
From a bond market perspective, the 0.52% increase in the 10-year yield directly eroded the dollar's interest rate differential. A flattening yield curve tends to weaken the dollar's safe-haven premium, especially against the backdrop of benign inflation data. The 3% annualized CPI reading for September prioritized concerns about price pressures stemming from tariff rhetoric. However, it also exposed divisions within the Federal Reserve: some policymakers are calling for a December rate cut, contingent on data, while leadership prefers to keep options open and avoid prematurely locking in a path. Economists at prominent institutions such as Deutsche Bank noted that Powell's decision not to pre-commit to year-end action at this week's press conference will exacerbate short-term uncertainty for the dollar. External factors further exacerbated this transmission: While Trump's tariff rhetoric lacked detailed details, it has fueled market concerns about the global trade landscape. Coupled with the partially positive news from the Southeast Asian trade agreement, the US dollar index faces a tug-of-war between bulls and bears.
From a technical perspective, the US dollar index has retreated from last week's high of 99.10, with the RSI (14) hovering around 45, indicating that oversold signs are gradually fading. However, if it falls below the lower limit of 98.77, it may test the monthly low support of 98.50. In terms of trading volume, the overnight equity market rebound (driven by trade optimism) echoed the retreat of safe assets. Although the intraday decline of the US dollar was limited, it reflected the diversion of funds to emerging markets (such as Argentina's reform expectations). Energy sanctions under the Russia-Ukraine situation have also indirectly reduced the demand for commodity currency hedging of the US dollar. This bond market-led US dollar fluctuation is similar to the period of curve inversion in 2019, but the current easing path is more clear. It is expected that if the durable goods data this week is weak, it will strengthen the downward pressure on the US dollar.
It's worth noting that the Fed's reshaping of its communication is also quietly influencing the dollar's trajectory. Institutional analysts expect this week's meeting to debate the interest rate path guidance, potentially introducing a more flexible "data-dependent" framework, which could curb the dollar's rebound in the short term. Combined with the 2-year yield at 3.501% (with an intraday range of 3.499%-3.512%), the upward trend in the short-term bond market has begun to erode the dollar's funding cost advantage, driving relative strength in major currencies like the euro and yen.
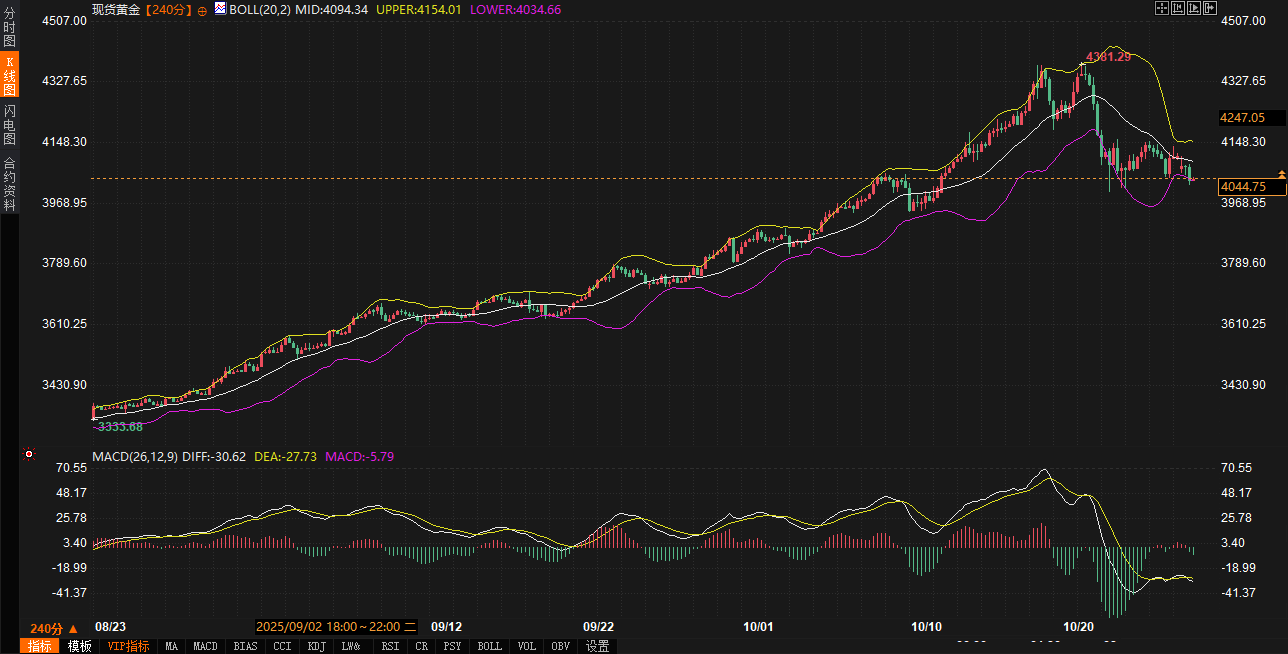
Spot gold's intraday decline closely mirrored the bond market's rebound, highlighting the bond market's role as a key enabler in the safe-haven market. The 240-minute chart shows a price of 4044.33, down 1.67%. The middle Bollinger Band at 4094.32 has become a resistance level, while the upper band at 4154.05 is far away, while the lower band at 4034.56 holds a key defense. The MACD indicator shows a DIFF of -30.67, a DEA of -27.73, and a bar chart of -5.85, continuing its downward trend. While momentum is slowing, there are no signs of a golden cross, suggesting that gold is testing the lower band of the correction. Expectations of a Fed rate cut should have boosted gold's zero-interest asset properties, but the rebound in bond yields quickly drew some safe-haven funds, and optimistic noise surrounding a trade deal further suppressed gold's upside potential.
Driven by fundamentals, gold's performance is heavily influenced by bond market fluctuations. The 10-year yield's return above 4% has directly increased the opportunity cost of holding gold. While market consensus on "additional adjustments" from the Federal Reserve remains strong, internal dissent (such as the hawkish stance of the Milan board members) and political pressure (such as external calls for lower interest rates) have created uncertainty. While tame September inflation data (3% annualized) mitigated the immediate impact of tariff talk, it also led investors to question gold's effectiveness as an inflation hedge. Leading institutional commentators have pointed out that gold's safe-haven narrative has been "overinterpreted" in a low-inflation environment, making it far less sensitive to price fluctuations than expected. This is consistent with the overnight rebound in equities: amid trade optimism, safe-haven assets retreated, putting gold under pressure of 1.67% during the day.
Technically, gold has retreated from this month's high of 4160, approaching the 38.2% Fibonacci retracement level of 4050. The Stochastic (14, 3, 3) is oversold below 20, suggesting potential for a short-term rebound. However, the bond market's transmission effect cannot be ignored: a flattening yield curve tends to amplify gold volatility, especially when short-term bonds (such as the 2-year 3.501%) rise, leading to a rotation into yield-yielding assets. While energy sanctions stemming from the Russia-Ukraine situation have heightened global uncertainty, the narrative of oversupply stemming from low oil prices has weakened gold's geopolitical premium. Signals of reform in Argentina's elections have also diverted safe-haven demand from emerging markets.
Gold's dependence on the bond market is particularly prominent in the current environment. A break below the lower Bollinger Band at 4034.56 could accelerate a test of the 4000 mark. Conversely, if the Federal Reserve sends clearer easing signals on Wednesday, a decline in yields would quickly impact gold's bullish momentum. Overnight trading indicates moderate gold futures volume and a bearish institutional bias. However, this week's auction series (particularly for the 5-year Treasury bond) could trigger a volatile rally between bonds and gold.
Looking ahead to the next two to three days, US Treasury yields are expected to remain in a narrow range of 4.00%-4.05% around the Fed meeting. If Powell's press conference emphasizes data dependence, yields could rise further to the upper limit of 4.04, continuing the curve flattening trend. The US dollar index, driven by the bond market, is expected to bottom out in the 98.50-99.10 range. Weak durable goods data could push the index lower, near 98.77, indicating weak short-term momentum. The bond market's risk-off transmission will continue to dominate spot gold prices, with prices likely fluctuating between 4030 and 4060. Holding the lower limit of 4034.56 will be crucial. If the yield curve steepness unexpectedly narrows, gold prices could rebound. The interplay of trade noise and policy signals within the overall rotation will amplify market divergence, but the anchoring of the easing path may limit extreme volatility.
Overall, with the Federal Reserve's policy meeting approaching, delayed labor market data and repercussions from trade frictions have driven a short-term divergence between the bond and foreign exchange markets. Analysts at prominent institutions point to this divergence as unexpectedly mild inflation data, while potential geopolitical risks and political noise continue to influence capital flows in the periphery. Close attention should be paid to the Fed's signals this week, as they will directly amplify the transmission effect on the bond market.
Bond market rebound: Fed's interest rate cut path may face resistance
The bond market's focus this week is undoubtedly on the Federal Reserve's decision. Markets generally expect the Fed to implement a 0.25 percentage point rate cut at its Wednesday meeting, bringing the policy rate range to 3.75%-4.00%. This would be the second such move this year and is intended to mitigate any further signs of a cooling labor market. Rising unemployment insurance claims suggest continued weakness in demand. While the government shutdown has delayed the release of most official statistics (such as the 4.3% unemployment rate in August), this has not weakened the consensus on easing. More importantly, the phrase "additional adjustments" embedded in last month's meeting statement was specifically emphasized by Fed Vice Chairman Michelle Bowman as a foreshadowing of future rate cuts. Analysts believe the Fed will be reluctant to change this wording to avoid prematurely signaling a dovish stance.
However, the intraday rebound in bond yields exposed internal divisions. The 10-year Treasury yield rebounded from the middle band of 3.989 to 4.025, approaching the upper Bollinger Band limit of 4.044, while the lower band of 3.934 provided short-term support. The MACD indicator showed a DIFF of 0.010 and a DEA of 0.003, with the histogram slightly turning positive near -0.007, suggesting a shift in short-term momentum from downside to a neutral to bullish stance. This echoed overnight headlines: Trump's trade agreement with Southeast Asian countries (such as Malaysia, Cambodia, Thailand, and Vietnam), which included tariff exemptions on some products in exchange for US purchase commitments, eased some trade uncertainty but also triggered a re-examination of the inflation path. The consumer price index rose to a lower-than-expected 3% annual rate in September, which should have reinforced expectations of a rate cut, but the aftermath of the tariff rhetoric has altered this outlook. Economists from well-known institutions have observed that cautious voices are growing within the Federal Reserve about further easing, with many policymakers worried that inflation will remain above the 2% target for a long time. Newly added board member Stephen Milan may dissent again this week and support a larger rate cut of 0.50%.
From a fundamental perspective, upward pressure on the bond market also stems from external events. Amidst low oil prices, Washington has intensified sanctions on Russia and Ukraine. While targeting two major Moscow energy producers hasn't directly impacted the bond market, it has reinforced the narrative of global oversupply and further depressed inflation premium expectations. Argentinian President Javier Milley's election victory has also injected a sliver of reform optimism into emerging markets, but the direct impact on US Treasuries has been limited. Technically, the slope of the 2-year and 10-year yield curves has narrowed from 52.2 basis points to a range of 49.9-53.1, while the 5-year to 30-year yield curves have fluctuated between 97.7-99.1, showing initial signs of overall curve flattening, which often signals a critical point in policy shifts. Watch out for durable goods orders data (expected to show a +0.5% month-over-month reading) and the Dallas Fed Texas Manufacturing Index (previous reading -8.7) due later on Monday; any surprises could further push the yield curve higher.
The bond market saw brisk intraday trading, with TYZ25 contracts reaching 279,000, above the recent average. Block trading was currently unavailable, but the $26 billion six-month bill auction and $69 billion two-year note tender at 11:30 will test the market's appetite for short-term yields. The $86 billion 13-week Treasury bill auction and $70 billion five-year note auction at 1:00 PM could exacerbate long-term volatility. Overall, the rebound in US Treasury yields is not isolated, but rather a prelude to a shift in the Federal Reserve's communication strategy. Institutions expect this week's meeting to discuss the timing of ending quantitative tightening (QT), possibly starting within the month. This will provide a downward buffer for yields, but political pressure (such as the Trump campaign's public calls for low interest rates) may maintain upward momentum in the short term.
US dollar under pressure: capital outflow under bond market transmission
The slight intraday decline in the US dollar index contrasts sharply with the rebound in bond yields, a typical manifestation of the bond-exchange rate linkage. On the 240-minute chart, the US dollar index is trading at 98.7860. The middle Bollinger Band at 98.9408 provides resistance, while the upper band at 99.1040 remains untouched. The lower band at 98.7777 has become immediate support. The MACD indicator's DIFF is 0.0208, the DEA at 0.0466, and the histogram at -0.0517 indicate that while downward momentum has slowed, it has not reversed, suggesting the index is on the verge of a rebound from the lower band. Expectations of a Fed rate cut should have supported the dollar's relative strength, but delayed labor market data and optimism about a trade deal have prompted an outflow of funds from US dollar assets into equities and commodities.
From a bond market perspective, the 0.52% increase in the 10-year yield directly eroded the dollar's interest rate differential. A flattening yield curve tends to weaken the dollar's safe-haven premium, especially against the backdrop of benign inflation data. The 3% annualized CPI reading for September prioritized concerns about price pressures stemming from tariff rhetoric. However, it also exposed divisions within the Federal Reserve: some policymakers are calling for a December rate cut, contingent on data, while leadership prefers to keep options open and avoid prematurely locking in a path. Economists at prominent institutions such as Deutsche Bank noted that Powell's decision not to pre-commit to year-end action at this week's press conference will exacerbate short-term uncertainty for the dollar. External factors further exacerbated this transmission: While Trump's tariff rhetoric lacked detailed details, it has fueled market concerns about the global trade landscape. Coupled with the partially positive news from the Southeast Asian trade agreement, the US dollar index faces a tug-of-war between bulls and bears.
From a technical perspective, the US dollar index has retreated from last week's high of 99.10, with the RSI (14) hovering around 45, indicating that oversold signs are gradually fading. However, if it falls below the lower limit of 98.77, it may test the monthly low support of 98.50. In terms of trading volume, the overnight equity market rebound (driven by trade optimism) echoed the retreat of safe assets. Although the intraday decline of the US dollar was limited, it reflected the diversion of funds to emerging markets (such as Argentina's reform expectations). Energy sanctions under the Russia-Ukraine situation have also indirectly reduced the demand for commodity currency hedging of the US dollar. This bond market-led US dollar fluctuation is similar to the period of curve inversion in 2019, but the current easing path is more clear. It is expected that if the durable goods data this week is weak, it will strengthen the downward pressure on the US dollar.
It's worth noting that the Fed's reshaping of its communication is also quietly influencing the dollar's trajectory. Institutional analysts expect this week's meeting to debate the interest rate path guidance, potentially introducing a more flexible "data-dependent" framework, which could curb the dollar's rebound in the short term. Combined with the 2-year yield at 3.501% (with an intraday range of 3.499%-3.512%), the upward trend in the short-term bond market has begun to erode the dollar's funding cost advantage, driving relative strength in major currencies like the euro and yen.
Gold safe haven: transmission effect under bond market volatility
Spot gold's intraday decline closely mirrored the bond market's rebound, highlighting the bond market's role as a key enabler in the safe-haven market. The 240-minute chart shows a price of 4044.33, down 1.67%. The middle Bollinger Band at 4094.32 has become a resistance level, while the upper band at 4154.05 is far away, while the lower band at 4034.56 holds a key defense. The MACD indicator shows a DIFF of -30.67, a DEA of -27.73, and a bar chart of -5.85, continuing its downward trend. While momentum is slowing, there are no signs of a golden cross, suggesting that gold is testing the lower band of the correction. Expectations of a Fed rate cut should have boosted gold's zero-interest asset properties, but the rebound in bond yields quickly drew some safe-haven funds, and optimistic noise surrounding a trade deal further suppressed gold's upside potential.
Driven by fundamentals, gold's performance is heavily influenced by bond market fluctuations. The 10-year yield's return above 4% has directly increased the opportunity cost of holding gold. While market consensus on "additional adjustments" from the Federal Reserve remains strong, internal dissent (such as the hawkish stance of the Milan board members) and political pressure (such as external calls for lower interest rates) have created uncertainty. While tame September inflation data (3% annualized) mitigated the immediate impact of tariff talk, it also led investors to question gold's effectiveness as an inflation hedge. Leading institutional commentators have pointed out that gold's safe-haven narrative has been "overinterpreted" in a low-inflation environment, making it far less sensitive to price fluctuations than expected. This is consistent with the overnight rebound in equities: amid trade optimism, safe-haven assets retreated, putting gold under pressure of 1.67% during the day.
Technically, gold has retreated from this month's high of 4160, approaching the 38.2% Fibonacci retracement level of 4050. The Stochastic (14, 3, 3) is oversold below 20, suggesting potential for a short-term rebound. However, the bond market's transmission effect cannot be ignored: a flattening yield curve tends to amplify gold volatility, especially when short-term bonds (such as the 2-year 3.501%) rise, leading to a rotation into yield-yielding assets. While energy sanctions stemming from the Russia-Ukraine situation have heightened global uncertainty, the narrative of oversupply stemming from low oil prices has weakened gold's geopolitical premium. Signals of reform in Argentina's elections have also diverted safe-haven demand from emerging markets.
Gold's dependence on the bond market is particularly prominent in the current environment. A break below the lower Bollinger Band at 4034.56 could accelerate a test of the 4000 mark. Conversely, if the Federal Reserve sends clearer easing signals on Wednesday, a decline in yields would quickly impact gold's bullish momentum. Overnight trading indicates moderate gold futures volume and a bearish institutional bias. However, this week's auction series (particularly for the 5-year Treasury bond) could trigger a volatile rally between bonds and gold.
Outlook: Bond, foreign exchange and financial market rotation intensifies, with short-term divergence likely to dominate
Looking ahead to the next two to three days, US Treasury yields are expected to remain in a narrow range of 4.00%-4.05% around the Fed meeting. If Powell's press conference emphasizes data dependence, yields could rise further to the upper limit of 4.04, continuing the curve flattening trend. The US dollar index, driven by the bond market, is expected to bottom out in the 98.50-99.10 range. Weak durable goods data could push the index lower, near 98.77, indicating weak short-term momentum. The bond market's risk-off transmission will continue to dominate spot gold prices, with prices likely fluctuating between 4030 and 4060. Holding the lower limit of 4034.56 will be crucial. If the yield curve steepness unexpectedly narrows, gold prices could rebound. The interplay of trade noise and policy signals within the overall rotation will amplify market divergence, but the anchoring of the easing path may limit extreme volatility.
- Risk Warning and Disclaimer
- The market involves risk, and trading may not be suitable for all investors. This article is for reference only and does not constitute personal investment advice, nor does it take into account certain users’ specific investment objectives, financial situation, or other needs. Any investment decisions made based on this information are at your own risk.