Concealment or Fear? An Interpretation of the Fed's Determined Rate Cuts in a "Data Vacuum"
2025-10-27 21:46:43
Federal Reserve Chairman Jerome Powell reiterates in nearly every press conference that "we are data-driven." This is the Fed's core mantra. The key message is that the Federal Open Market Committee (FOMC) will not follow a pre-set path but will instead make decisions meeting by meeting based on the latest economic data from various official sources. But what is happening in reality? This article reveals some clues that suggest the Fed appears to be increasingly moving away from data-driven decision-making.

At the National Association for Business Economics conference in Philadelphia on October 14, Powell made it clear that the Fed will continue to advance its decision-making even though the current federal government shutdown has entered its fourth week, resulting in interruptions in the release of official data.
Even Friday's delayed September inflation report, which showed an acceleration in overall annual inflation, did little to prevent the Federal Reserve from cutting the federal funds rate again on Wednesday.
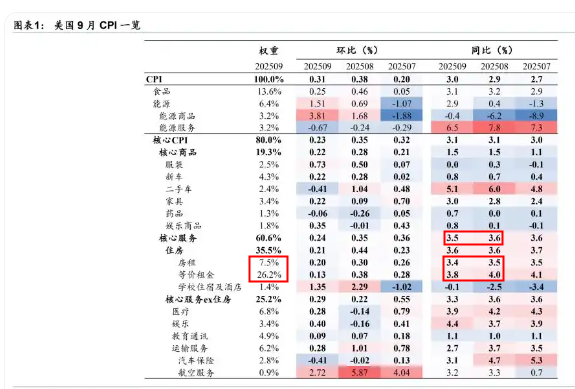
U.S. core inflation data for September ultimately came in slightly below almost all market expectations. The dominant driver of this slowdown in inflation was housing costs, and there is little evidence that the cost of tariffs has been passed through to core goods prices.
However, it should be noted that beneath the surface, the prices of core services are actually rising, that is, the prices of core food and services are all rising.
As can be seen in the chart below, rent and equivalent rent, which have weights of 7.5% and 26.2%, fell by 0.1% and 0.2% respectively, while the core services index fell from 3.6 to 3.5, a mere 0.1 drop. This means that the overall core services CPI, excluding rent, is rising.
(A look at the breakdown of U.S. CPI data for September)
In short, the Fed seems determined to continue its loose monetary policy, and the data is meaningless.
Market expectations for further rate cuts are almost unanimous, leaving the Federal Reserve with only one viable path: cut rates to meet market expectations.
If the Fed does nothing, it could trigger investor panic, causing the stock market to plummet and Treasury yields to soar - and could even trigger the financial crisis the Fed is trying to avoid.
Today's Federal Reserve is no longer a market leader, but only a market follower.
Where might the next crisis originate? The most likely trigger might be the high-yield bond market: even with continued easing of credit in recent months, credit spreads in this market have remained unusually narrow.
The recent bankruptcies of auto parts maker FirstBrands and subprime lender Tricolor, while not necessarily systemic, have exposed cracks beneath the surface of the market. But how deep do these cracks run?
The banking system is another weak link. Bank reserves are no longer considered “ample” – the Fed’s official language, which suggests a looming funding shortage.
Considering that the credit environment has eased significantly since September 2019, the severity of this funding shortage crisis may exceed the liquidity tightening that year.
The liquidity tightening in 2019 prompted the Federal Reserve to end its balance sheet reduction process and start expanding it again.
Perhaps this is why Powell hinted at an end to quantitative tightening (QT) in his speech in Philadelphia - even though the current size of the Federal Reserve's balance sheet, both in absolute terms and as a percentage of gross domestic product (GDP), has exceeded the pre-COVID-19 level.
Don’t be surprised if the Fed announces the end of QT at the end of the two-day FOMC meeting next week.
What are the problems with such a move? As we have witnessed since September 2008, the Fed's weight in the economy continues to grow with each crisis.
The quantitative easing (QE) policy launched by former Federal Reserve Chairman Ben Bernanke in late 2008 was initially defined as a "temporary" measure, but eventually evolved into a "monster".
In 2008, the Federal Reserve held only $780 billion in Treasury bonds, accounting for 12% of outstanding Treasury bonds; by 2014, it had increased to $2.47 trillion, and the proportion rose to 17%.
As of 2023, the Federal Reserve still holds $4.92 trillion in Treasury bonds, accounting for 61.65% of its total assets, making it the "largest single holder" of U.S. Treasury bonds.
Today, the Fed's balance sheet has expanded to more than eight times its initial size! In essence, the Fed positions itself as the solver of all problems (whether monetary or structural), and the solution to each crisis sows the seeds for the next one.
This kind of bureaucratic overreach may become a tool in Washington's power game, but it will have little effect on maintaining market stability.
Such actions would also distract the Fed from its sole objective: maintaining low and stable inflation. Ultimately, none of its objectives could achieve the desired effect.
The current US dollar index is being suppressed by the misaligned policy logic of the Federal Reserve. The core reason is two major factors: First, the divergent data is forcing easing (interest rate cuts + or termination of QT), which directly narrows the interest rate gap between the US and Europe and weakens the support for the US dollar interest rate gap. The rising expectations for the termination of QT further release signals of liquidity easing.
Second, the Federal Reserve has fallen from being "data-dependent" to a "market follower", its policy independence has been damaged, the credit premium of the US dollar has been weakened, and global capital's trust in it has declined.
In the short term, the index has already priced in easing expectations. If the FOMC decision is delivered this week, the index is likely to continue its downward trend, approaching the key support level of 98. While risks such as high-yield bond defaults and bank liquidity shortages could theoretically boost safe-haven sentiment, the market is more focused on the supportive effect of easing on assets, forcing a limited rebound in the US dollar.
The US dollar index has not hit a new high for 10 trading days, and has closed below the previous key neckline for four consecutive days. In addition, the short-term rising trend line of the US dollar index is about to be broken, which suggests that the US dollar index may be weakening and may end this rebound at any time.
The technical analysis in the previous article follows the same point of view. Before the US dollar index rises above 99.36, it should be considered as a rebound. Since it is a rebound, it will eventually continue to search for a bottom in the original direction.
The pressure level of the US dollar index is the orange neckline and 99.36, and the support level is the rising trend line and 98.61 and the distant 97.55.
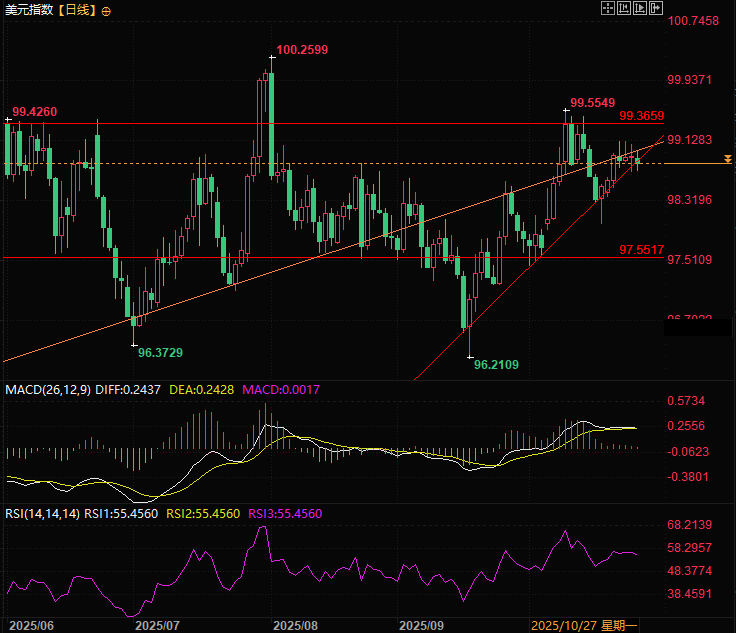
(Daily chart of the US dollar index, source: Yihuitong)
At 21:43 Beijing time, the US dollar index is currently at 98.84.
The Fed's "data-dependent" creed is out of touch with reality
At the National Association for Business Economics conference in Philadelphia on October 14, Powell made it clear that the Fed will continue to advance its decision-making even though the current federal government shutdown has entered its fourth week, resulting in interruptions in the release of official data.
Even Friday's delayed September inflation report, which showed an acceleration in overall annual inflation, did little to prevent the Federal Reserve from cutting the federal funds rate again on Wednesday.
September inflation data breakdown: surface cooling, core warming
U.S. core inflation data for September ultimately came in slightly below almost all market expectations. The dominant driver of this slowdown in inflation was housing costs, and there is little evidence that the cost of tariffs has been passed through to core goods prices.
However, it should be noted that beneath the surface, the prices of core services are actually rising, that is, the prices of core food and services are all rising.
As can be seen in the chart below, rent and equivalent rent, which have weights of 7.5% and 26.2%, fell by 0.1% and 0.2% respectively, while the core services index fell from 3.6 to 3.5, a mere 0.1 drop. This means that the overall core services CPI, excluding rent, is rising.
(A look at the breakdown of U.S. CPI data for September)
The Federal Reserve has fallen from being "data-driven" to being a "market follower"
In short, the Fed seems determined to continue its loose monetary policy, and the data is meaningless.
Market expectations for further rate cuts are almost unanimous, leaving the Federal Reserve with only one viable path: cut rates to meet market expectations.
If the Fed does nothing, it could trigger investor panic, causing the stock market to plummet and Treasury yields to soar - and could even trigger the financial crisis the Fed is trying to avoid.
Today's Federal Reserve is no longer a market leader, but only a market follower.
Hidden Crisis: High-Yield Bond Cracks and Banking System Liquidity Risks
Where might the next crisis originate? The most likely trigger might be the high-yield bond market: even with continued easing of credit in recent months, credit spreads in this market have remained unusually narrow.
The recent bankruptcies of auto parts maker FirstBrands and subprime lender Tricolor, while not necessarily systemic, have exposed cracks beneath the surface of the market. But how deep do these cracks run?
The banking system is another weak link. Bank reserves are no longer considered “ample” – the Fed’s official language, which suggests a looming funding shortage.
Considering that the credit environment has eased significantly since September 2019, the severity of this funding shortage crisis may exceed the liquidity tightening that year.
The liquidity tightening in 2019 prompted the Federal Reserve to end its balance sheet reduction process and start expanding it again.
QT may be terminated early, and the hidden danger of balance sheet expansion
Perhaps this is why Powell hinted at an end to quantitative tightening (QT) in his speech in Philadelphia - even though the current size of the Federal Reserve's balance sheet, both in absolute terms and as a percentage of gross domestic product (GDP), has exceeded the pre-COVID-19 level.
Don’t be surprised if the Fed announces the end of QT at the end of the two-day FOMC meeting next week.
What are the problems with such a move? As we have witnessed since September 2008, the Fed's weight in the economy continues to grow with each crisis.
The quantitative easing (QE) policy launched by former Federal Reserve Chairman Ben Bernanke in late 2008 was initially defined as a "temporary" measure, but eventually evolved into a "monster".
In 2008, the Federal Reserve held only $780 billion in Treasury bonds, accounting for 12% of outstanding Treasury bonds; by 2014, it had increased to $2.47 trillion, and the proportion rose to 17%.
As of 2023, the Federal Reserve still holds $4.92 trillion in Treasury bonds, accounting for 61.65% of its total assets, making it the "largest single holder" of U.S. Treasury bonds.
Today, the Fed's balance sheet has expanded to more than eight times its initial size! In essence, the Fed positions itself as the solver of all problems (whether monetary or structural), and the solution to each crisis sows the seeds for the next one.
This kind of bureaucratic overreach may become a tool in Washington's power game, but it will have little effect on maintaining market stability.
Such actions would also distract the Fed from its sole objective: maintaining low and stable inflation. Ultimately, none of its objectives could achieve the desired effect.
Transaction Summary:
The current US dollar index is being suppressed by the misaligned policy logic of the Federal Reserve. The core reason is two major factors: First, the divergent data is forcing easing (interest rate cuts + or termination of QT), which directly narrows the interest rate gap between the US and Europe and weakens the support for the US dollar interest rate gap. The rising expectations for the termination of QT further release signals of liquidity easing.
Second, the Federal Reserve has fallen from being "data-dependent" to a "market follower", its policy independence has been damaged, the credit premium of the US dollar has been weakened, and global capital's trust in it has declined.
In the short term, the index has already priced in easing expectations. If the FOMC decision is delivered this week, the index is likely to continue its downward trend, approaching the key support level of 98. While risks such as high-yield bond defaults and bank liquidity shortages could theoretically boost safe-haven sentiment, the market is more focused on the supportive effect of easing on assets, forcing a limited rebound in the US dollar.
Technical Analysis:
The US dollar index has not hit a new high for 10 trading days, and has closed below the previous key neckline for four consecutive days. In addition, the short-term rising trend line of the US dollar index is about to be broken, which suggests that the US dollar index may be weakening and may end this rebound at any time.
The technical analysis in the previous article follows the same point of view. Before the US dollar index rises above 99.36, it should be considered as a rebound. Since it is a rebound, it will eventually continue to search for a bottom in the original direction.
The pressure level of the US dollar index is the orange neckline and 99.36, and the support level is the rising trend line and 98.61 and the distant 97.55.
(Daily chart of the US dollar index, source: Yihuitong)
At 21:43 Beijing time, the US dollar index is currently at 98.84.
- Risk Warning and Disclaimer
- The market involves risk, and trading may not be suitable for all investors. This article is for reference only and does not constitute personal investment advice, nor does it take into account certain users’ specific investment objectives, financial situation, or other needs. Any investment decisions made based on this information are at your own risk.