The Greenland dispute triggers safe-haven demand, gold is consolidating at high levels, with 4700 within reach?
2026-01-20 10:08:45
On Tuesday (January 20) during the Asian session, spot gold traded in a narrow range around $4,670 per ounce, near its historical high. Spot gold started the week with a clear bullish bias, rising over 1.5% on Monday and briefly touching a record high of $4,690.46 per ounce. In the short term, recent comments from the US government regarding the potential reimposition of tariffs on Europe due to disputes over the future of Greenland have exacerbated geopolitical uncertainty, thereby boosting new demand.
This backdrop has further heightened market risk awareness and enhanced gold's appeal as a safe-haven asset, a scenario that is likely to continue supporting gold prices in the coming trading days.

Last weekend, US President Donald Trump announced a potential 10% tariff increase on goods imported from eight European countries, scheduled to take effect on February 1. According to the president, this decision stems from opposition from several European countries to his intention to purchase or control Greenland, a territory he considers strategically important to the United States from a geopolitical and geostrategic perspective. He also warned that if no agreement is reached with the European bloc, these tariffs could rise to 25% starting June 1.
Europe reacted swiftly, rejecting the threats and declaring the tariffs unacceptable while reiterating that Greenland is not for sale. Furthermore, officials warned that these measures could not only provoke commercial retaliation but also worsen diplomatic relations between the two regions with close trade and military ties. So far, there have been no reports of substantial progress in de-escalating the conflict, and Europe has called for a special meeting, which has begun to translate into increased uncertainty in market confidence.
This environment has exacerbated uncertainty, as market assessments suggest a strong European response could negatively impact US export performance, thus putting pressure on the dollar in the short term. Indeed, this shift is already evident in the dollar index, which retreated significantly on Monday after hitting a near seven-week high of 99.49, falling approximately 0.49%, indicating renewed dollar weakness. On Tuesday in Asian trading, the dollar index traded in a narrow range around 99.10.

(US Dollar Index Daily Chart, Source: FX678)
Against this backdrop, escalating diplomatic and trade tensions appear to be putting pressure on the dollar, while gold is beginning to absorb some of the capital flowing out of the currency market . As long as geopolitical risks remain high and the dollar remains weak, gold is likely to continue to serve as a hedging asset, benefiting from the temporary loss of market confidence in the dollar until the direction of trade negotiations becomes clearer.
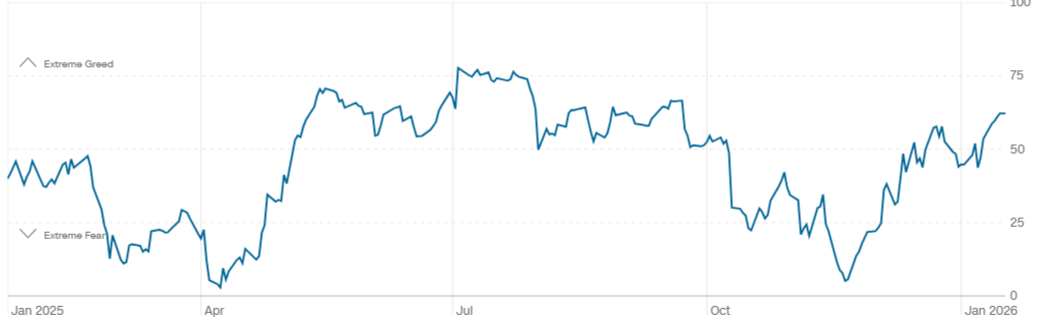
Gold typically benefits during periods of deteriorating market confidence, a dynamic that is already beginning to emerge in key indicators. CNN’s Fear & Greed Index is around 62, still in the “greed” zone, but the index curve has begun to flatten significantly, suggesting that short-term market uncertainty is resurfacing.
If this gradual erosion of confidence solidifies in the coming trading days, the market may shift towards a more risk-averse environment, thereby increasing demand for safe-haven assets . In this scenario, gold's importance as a capital preservation tool will become more prominent, and it may continue to face buying pressure in the short term .
Main bullish trend: Over the past few months, gold has maintained a robust bullish structure, characterized by continuously rising highs and lows, repeatedly pushing prices to new all-time highs. Currently, there are no clear technical signals indicating a trend reversal, but as prices approach the key psychological level ($4700), they may enter a consolidation phase or undergo a technical pullback before the upward trend resumes.
Relative Strength Index (RSI): The RSI indicator remains in overbought territory, not far above 70. Meanwhile, a bearish divergence has formed, characterized by prices making higher highs while the indicator shows lower highs. This pattern suggests that buying momentum may be weakening in the short term, opening the door to a technical pullback.
MACD indicator: The MACD oscillator is in positive territory, indicating that there is still room for gold prices to rise.
Key price levels to watch:
$4,700 – Key Resistance Level: This price level is a major psychological barrier for the market, especially considering the lack of historical reference levels above it. A sustained hold above this level would strengthen the bullish bias and open the way for new highs in the short term.
$4550 – Recent Support Level: This level is close to the previous all-time high and has become an important technical reference point. If a pullback occurs, this price level can act as short-term support, helping to determine whether the bullish structure remains intact.
$4315 – Key Support Level: This technical level is formed by the convergence of the 50-period simple moving average (SMA, $4314.20) and the recent upward trendline. A price drop to this level will test the current bullish structure; a decisive break below this level could open the way for a more significant bearish bias in subsequent trading sessions.
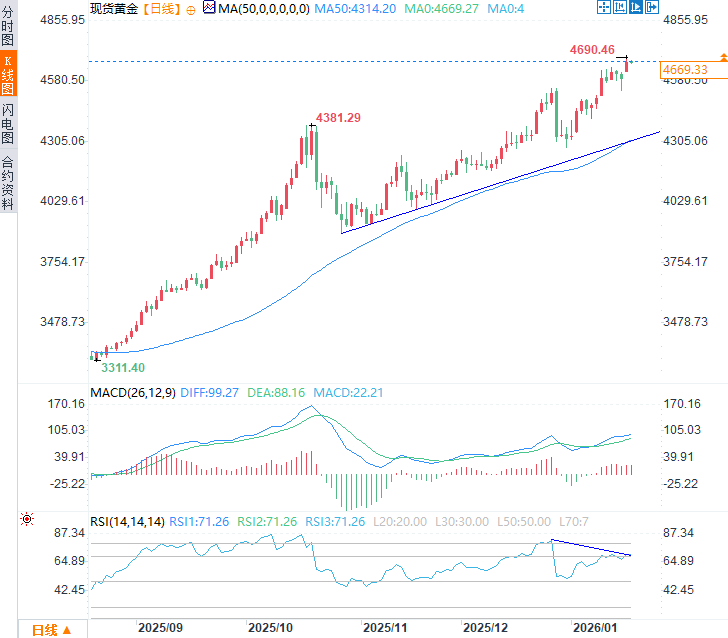
(Spot gold daily chart, source: FX678)
At 10:08 Beijing time, spot gold was trading at $4,666.45 per ounce.
This backdrop has further heightened market risk awareness and enhanced gold's appeal as a safe-haven asset, a scenario that is likely to continue supporting gold prices in the coming trading days.
Trade tensions escalate
Last weekend, US President Donald Trump announced a potential 10% tariff increase on goods imported from eight European countries, scheduled to take effect on February 1. According to the president, this decision stems from opposition from several European countries to his intention to purchase or control Greenland, a territory he considers strategically important to the United States from a geopolitical and geostrategic perspective. He also warned that if no agreement is reached with the European bloc, these tariffs could rise to 25% starting June 1.
Europe reacted swiftly, rejecting the threats and declaring the tariffs unacceptable while reiterating that Greenland is not for sale. Furthermore, officials warned that these measures could not only provoke commercial retaliation but also worsen diplomatic relations between the two regions with close trade and military ties. So far, there have been no reports of substantial progress in de-escalating the conflict, and Europe has called for a special meeting, which has begun to translate into increased uncertainty in market confidence.
This environment has exacerbated uncertainty, as market assessments suggest a strong European response could negatively impact US export performance, thus putting pressure on the dollar in the short term. Indeed, this shift is already evident in the dollar index, which retreated significantly on Monday after hitting a near seven-week high of 99.49, falling approximately 0.49%, indicating renewed dollar weakness. On Tuesday in Asian trading, the dollar index traded in a narrow range around 99.10.
(US Dollar Index Daily Chart, Source: FX678)
Against this backdrop, escalating diplomatic and trade tensions appear to be putting pressure on the dollar, while gold is beginning to absorb some of the capital flowing out of the currency market . As long as geopolitical risks remain high and the dollar remains weak, gold is likely to continue to serve as a hedging asset, benefiting from the temporary loss of market confidence in the dollar until the direction of trade negotiations becomes clearer.
Is market confidence at risk again?
Gold typically benefits during periods of deteriorating market confidence, a dynamic that is already beginning to emerge in key indicators. CNN’s Fear & Greed Index is around 62, still in the “greed” zone, but the index curve has begun to flatten significantly, suggesting that short-term market uncertainty is resurfacing.
If this gradual erosion of confidence solidifies in the coming trading days, the market may shift towards a more risk-averse environment, thereby increasing demand for safe-haven assets . In this scenario, gold's importance as a capital preservation tool will become more prominent, and it may continue to face buying pressure in the short term .
Gold Technical Outlook
Main bullish trend: Over the past few months, gold has maintained a robust bullish structure, characterized by continuously rising highs and lows, repeatedly pushing prices to new all-time highs. Currently, there are no clear technical signals indicating a trend reversal, but as prices approach the key psychological level ($4700), they may enter a consolidation phase or undergo a technical pullback before the upward trend resumes.
Relative Strength Index (RSI): The RSI indicator remains in overbought territory, not far above 70. Meanwhile, a bearish divergence has formed, characterized by prices making higher highs while the indicator shows lower highs. This pattern suggests that buying momentum may be weakening in the short term, opening the door to a technical pullback.
MACD indicator: The MACD oscillator is in positive territory, indicating that there is still room for gold prices to rise.
Key price levels to watch:
$4,700 – Key Resistance Level: This price level is a major psychological barrier for the market, especially considering the lack of historical reference levels above it. A sustained hold above this level would strengthen the bullish bias and open the way for new highs in the short term.
$4550 – Recent Support Level: This level is close to the previous all-time high and has become an important technical reference point. If a pullback occurs, this price level can act as short-term support, helping to determine whether the bullish structure remains intact.
$4315 – Key Support Level: This technical level is formed by the convergence of the 50-period simple moving average (SMA, $4314.20) and the recent upward trendline. A price drop to this level will test the current bullish structure; a decisive break below this level could open the way for a more significant bearish bias in subsequent trading sessions.
(Spot gold daily chart, source: FX678)
At 10:08 Beijing time, spot gold was trading at $4,666.45 per ounce.
- Risk Warning and Disclaimer
- The market involves risk, and trading may not be suitable for all investors. This article is for reference only and does not constitute personal investment advice, nor does it take into account certain users’ specific investment objectives, financial situation, or other needs. Any investment decisions made based on this information are at your own risk.