Political noise dominates dollar index fluctuations; pullbacks are not sell-offs.
2026-01-20 20:09:35
The US dollar index has indeed seen a significant pullback in the past two days, falling from its high of around 99.39 last week to around 98.50 (with an intraday low of 98.44-98.67), a daily drop of about 0.5-0.9%, continuing its downward trend for the second day.
This is not an isolated phenomenon, but the result of multiple factors: on the one hand, the market's immediate reaction to the political risks posed by Trump; on the other hand, the combined effect of global bond market linkages and technical adjustments. Simply put, the core of this correction is "a shift in risk aversion + increased demand for risk hedging," rather than simply "selling off US assets."
Let's look at the surface drivers first. Gold and silver have indeed surged—gold broke through $4,700/ounce and silver approached $95/ounce—which directly squeezed the safe-haven status of the US dollar, causing funds to flow from the dollar to precious metals.
Meanwhile, the US dollar index encountered resistance after a slight rise last week (the 99.3-99.5 resistance zone), and indicators such as the RSI showed overbought conditions, so a technical correction was to be expected.
Underlying reasons: Political uncertainty + global capital flows
But these are only the surface reasons; the deeper reasons lie in political uncertainty and global capital flows.
Trump's tariff threats and Greenland proposal became the trigger. Over the weekend, he reiterated his intention to "completely acquire" Greenland and threatened to impose an additional 10% tariff on eight countries—Denmark, Norway, Sweden, France, Germany, the Netherlands, Finland, and the United Kingdom—starting February 1, which would rise to 25% if no agreement was reached by June 1.
This directly ignited a "sell America" sentiment: European stocks fell by more than 1% yesterday, and US stock futures also dropped by about 1.5% before the market opened today (S&P 500 futures fell by about 1.8%). The US dollar subsequently came under pressure, and the euro rose to around 1.17.
The market is worried that this could repeat the scenario following last year's "Liberation Day" – when a brief sell-off in April was followed by a rapid shift by investors to increase their dollar hedging, leading to subsequent buying. A similar logic is now playing out: global investors (especially in Japan and China) are reducing their dollar exposure and hedging against currency risks, rather than directly selling assets.
Global bond market linkages: Japanese fiscal stimulus spills over into US Treasury bonds
The fiscal stimulus measures introduced in Japan before the election (including a reduction in food sales tax) triggered a massive sell-off of Japanese government bonds, with long-term bond yields hitting record highs. This selling pressure spilled over into the global bond market.
The yield on 10-year U.S. Treasury bonds rose to 4.28%-4.29% (a four-month high), while the 30-year yield approached 4.93%. The decline in Treasury prices, seemingly a "sell-off of U.S. bonds," is actually a cross-border chain reaction triggered by Japan's fiscal expansion.
Data-wise: Employment remains stable, but is overshadowed by political noise.
Let's look at the supporting data. The US market reopened today after the holiday, with the only economic data release being the ADP employment report (private sector employment). Market expectations remain in the 10,000-12,000 range (averaging around 11,750 in recent weeks), indicating that while hiring in the US job market has slowed, it has not deteriorated.
This should have provided some support for the dollar, but political noise overshadowed the fundamentals. The USD/JPY pair was relatively strong (the yen weakened due to the sell-off of Japanese government bonds), which limited the dollar index from falling further, but the dollar remained weak overall.
Regarding rumors of a "retaliatory sell-off": Limited feasibility in reality.
Regarding the rumors of a "retaliatory sell-off"—many people are worried that Europe will withdraw $8-12 trillion in investment as a countermeasure, but this is unlikely.
It's difficult for governments to force the private sector to sell off their holdings, and the holding structure of US Treasury bonds shows that European data largely represents an "intermediary": the UK holds $800 billion, Belgium $399 billion, Luxembourg $328 billion, Switzerland $243 billion, Norway $218 billion, and Ireland $238 billion (the latter mostly held by US technology companies). The actual ultimate owners are not citizens of these countries, and strong demand from the US private sector has buffered the impact of official sell-offs.
The U.S. net international investment position deficit has reached $27 trillion, and liabilities increased by $3.2 trillion in the third quarter of last year (half of which came from valuation changes). This has made European investors reluctant to exit the market easily—unless the outlook for U.S. asset returns deteriorates significantly.
Pullbacks are more about risk hedging.
The most reasonable interpretation is that this pullback is more of a risk hedging than a pure sell-off.
If Trump's trade policies, geopolitical tensions (Greenland, threats to Fed independence), and expectations of further Fed rate cuts escalate, investors will continue to increase their hedging of dollar exposure. Japan has room to increase hedging, and China's dollar hoarding may also decrease (due to anticipated dollar weakness). This trend will be amplified if the Fed continues to cut rates this year, lowering hedging costs.
However, it is too early to assert that the dollar will depreciate on a large scale—after all, the fundamentals (stable employment, AI growth) remain, and there is much "bargaining" involved before Trump's policies are implemented.
Tomorrow (January 21), Trump's speech in Davos will be a key moment: if he softens his tone or talks about the agreement, the market may rebound quickly; conversely, if he continues to be tough (including a potential 200% tariff on French wine), the EU meeting on Thursday may activate €93 billion in retaliatory measures, and the dollar's pullback may continue.
Overall, the US dollar index is likely to fluctuate within the 98-99 range in the short term, with political news dominating. Long-term credit risks do exist (de-dollarization, geopolitical tensions), but the actual implementation of policies and changes in hedging flows need to be observed.
Technical Analysis
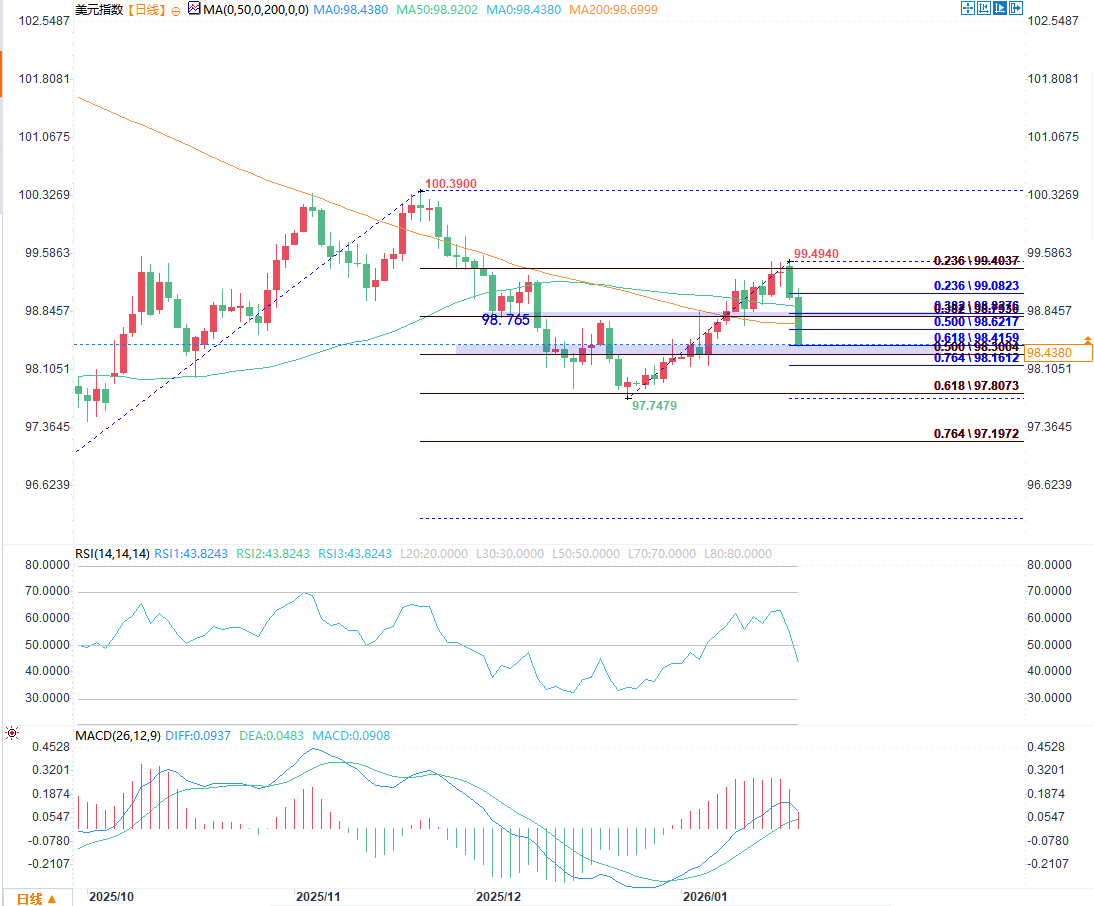
(US Dollar Index Daily Chart Source: FX678)
The current support zone for the US dollar index is very clear, with the core support area falling between 98.30 and 98.42. This zone coincides with the convergence of the blue Fibonacci 0.618 level and the orange Fibonacci 0.5 level, and also highly overlaps with the recent pullback lows, making the technical support quite strong. If this zone is breached, the next support level will be the blue Fibonacci 0.764 level at 98.16, while the ultimate support lies near the previous important low of 97.75, which also represents a temporary bottom in the larger-cycle downtrend.
From a resistance perspective, the most direct strong resistance zone is located in the 98.70–98.78 range. This area is doubly suppressed by the blue Fibonacci 0.382 level and the orange Fibonacci 0.618 level, as well as the opposing force of short-term moving averages. This is the first key hurdle for any price rebound. If this area is broken, the next resistance level will be the blue Fibonacci 0.236 level at 99.08 and the MA50 moving average. The previous high of 99.49 in this rebound is the ultimate target that the bulls need to challenge.
Overall, the current price is at a balance point between bullish and bearish forces: if the support zone of 98.30–98.42 holds, there is a chance to rebound towards the resistance zone of 98.70–98.78; once the support is breached, a new round of decline will begin. The resistance zone of 98.70–98.78 will be an important indicator for judging the short-term trend; a valid breakout will confirm the end of the pullback and a return to the uptrend.
This is not an isolated phenomenon, but the result of multiple factors: on the one hand, the market's immediate reaction to the political risks posed by Trump; on the other hand, the combined effect of global bond market linkages and technical adjustments. Simply put, the core of this correction is "a shift in risk aversion + increased demand for risk hedging," rather than simply "selling off US assets."
Let's look at the surface drivers first. Gold and silver have indeed surged—gold broke through $4,700/ounce and silver approached $95/ounce—which directly squeezed the safe-haven status of the US dollar, causing funds to flow from the dollar to precious metals.
Meanwhile, the US dollar index encountered resistance after a slight rise last week (the 99.3-99.5 resistance zone), and indicators such as the RSI showed overbought conditions, so a technical correction was to be expected.
Underlying reasons: Political uncertainty + global capital flows
But these are only the surface reasons; the deeper reasons lie in political uncertainty and global capital flows.
Trump's tariff threats and Greenland proposal became the trigger. Over the weekend, he reiterated his intention to "completely acquire" Greenland and threatened to impose an additional 10% tariff on eight countries—Denmark, Norway, Sweden, France, Germany, the Netherlands, Finland, and the United Kingdom—starting February 1, which would rise to 25% if no agreement was reached by June 1.
This directly ignited a "sell America" sentiment: European stocks fell by more than 1% yesterday, and US stock futures also dropped by about 1.5% before the market opened today (S&P 500 futures fell by about 1.8%). The US dollar subsequently came under pressure, and the euro rose to around 1.17.
The market is worried that this could repeat the scenario following last year's "Liberation Day" – when a brief sell-off in April was followed by a rapid shift by investors to increase their dollar hedging, leading to subsequent buying. A similar logic is now playing out: global investors (especially in Japan and China) are reducing their dollar exposure and hedging against currency risks, rather than directly selling assets.
Global bond market linkages: Japanese fiscal stimulus spills over into US Treasury bonds
The fiscal stimulus measures introduced in Japan before the election (including a reduction in food sales tax) triggered a massive sell-off of Japanese government bonds, with long-term bond yields hitting record highs. This selling pressure spilled over into the global bond market.
The yield on 10-year U.S. Treasury bonds rose to 4.28%-4.29% (a four-month high), while the 30-year yield approached 4.93%. The decline in Treasury prices, seemingly a "sell-off of U.S. bonds," is actually a cross-border chain reaction triggered by Japan's fiscal expansion.
Data-wise: Employment remains stable, but is overshadowed by political noise.
Let's look at the supporting data. The US market reopened today after the holiday, with the only economic data release being the ADP employment report (private sector employment). Market expectations remain in the 10,000-12,000 range (averaging around 11,750 in recent weeks), indicating that while hiring in the US job market has slowed, it has not deteriorated.
This should have provided some support for the dollar, but political noise overshadowed the fundamentals. The USD/JPY pair was relatively strong (the yen weakened due to the sell-off of Japanese government bonds), which limited the dollar index from falling further, but the dollar remained weak overall.
Regarding rumors of a "retaliatory sell-off": Limited feasibility in reality.
Regarding the rumors of a "retaliatory sell-off"—many people are worried that Europe will withdraw $8-12 trillion in investment as a countermeasure, but this is unlikely.
It's difficult for governments to force the private sector to sell off their holdings, and the holding structure of US Treasury bonds shows that European data largely represents an "intermediary": the UK holds $800 billion, Belgium $399 billion, Luxembourg $328 billion, Switzerland $243 billion, Norway $218 billion, and Ireland $238 billion (the latter mostly held by US technology companies). The actual ultimate owners are not citizens of these countries, and strong demand from the US private sector has buffered the impact of official sell-offs.
The U.S. net international investment position deficit has reached $27 trillion, and liabilities increased by $3.2 trillion in the third quarter of last year (half of which came from valuation changes). This has made European investors reluctant to exit the market easily—unless the outlook for U.S. asset returns deteriorates significantly.
Pullbacks are more about risk hedging.
The most reasonable interpretation is that this pullback is more of a risk hedging than a pure sell-off.
If Trump's trade policies, geopolitical tensions (Greenland, threats to Fed independence), and expectations of further Fed rate cuts escalate, investors will continue to increase their hedging of dollar exposure. Japan has room to increase hedging, and China's dollar hoarding may also decrease (due to anticipated dollar weakness). This trend will be amplified if the Fed continues to cut rates this year, lowering hedging costs.
However, it is too early to assert that the dollar will depreciate on a large scale—after all, the fundamentals (stable employment, AI growth) remain, and there is much "bargaining" involved before Trump's policies are implemented.
Tomorrow (January 21), Trump's speech in Davos will be a key moment: if he softens his tone or talks about the agreement, the market may rebound quickly; conversely, if he continues to be tough (including a potential 200% tariff on French wine), the EU meeting on Thursday may activate €93 billion in retaliatory measures, and the dollar's pullback may continue.
Overall, the US dollar index is likely to fluctuate within the 98-99 range in the short term, with political news dominating. Long-term credit risks do exist (de-dollarization, geopolitical tensions), but the actual implementation of policies and changes in hedging flows need to be observed.
Technical Analysis
(US Dollar Index Daily Chart Source: FX678)
The current support zone for the US dollar index is very clear, with the core support area falling between 98.30 and 98.42. This zone coincides with the convergence of the blue Fibonacci 0.618 level and the orange Fibonacci 0.5 level, and also highly overlaps with the recent pullback lows, making the technical support quite strong. If this zone is breached, the next support level will be the blue Fibonacci 0.764 level at 98.16, while the ultimate support lies near the previous important low of 97.75, which also represents a temporary bottom in the larger-cycle downtrend.
From a resistance perspective, the most direct strong resistance zone is located in the 98.70–98.78 range. This area is doubly suppressed by the blue Fibonacci 0.382 level and the orange Fibonacci 0.618 level, as well as the opposing force of short-term moving averages. This is the first key hurdle for any price rebound. If this area is broken, the next resistance level will be the blue Fibonacci 0.236 level at 99.08 and the MA50 moving average. The previous high of 99.49 in this rebound is the ultimate target that the bulls need to challenge.
Overall, the current price is at a balance point between bullish and bearish forces: if the support zone of 98.30–98.42 holds, there is a chance to rebound towards the resistance zone of 98.70–98.78; once the support is breached, a new round of decline will begin. The resistance zone of 98.70–98.78 will be an important indicator for judging the short-term trend; a valid breakout will confirm the end of the pullback and a return to the uptrend.
- Risk Warning and Disclaimer
- The market involves risk, and trading may not be suitable for all investors. This article is for reference only and does not constitute personal investment advice, nor does it take into account certain users’ specific investment objectives, financial situation, or other needs. Any investment decisions made based on this information are at your own risk.