WTI Crude Oil: Volatile Pattern and Key Breakout Signals Amid Supply-Driven Game
2026-01-27 19:48:54
Tuesday (January 27) saw mixed trading during the European session, with traders focusing on the $60.51 level, corresponding to the 200-day moving average, where bulls and bears were briefly locked in a stalemate. Expectations of oversupply continued to suppress price gains, but the potential for supply disruptions from Iran provided support. With these factors offsetting each other, the overall market tone leaned neutral. However, it's worth noting that geopolitical risks and short-term supply disruptions caused by extreme weather are acting as a significant buffer for prices, effectively limiting further downside. March WTI crude oil futures were trading at $60.96, up $0.33, or 0.55%.
WTI crude oil is currently in a complex situation with intertwined bullish and bearish factors. Supply-side uncertainties and key technical resistance levels are creating a dual struggle, resulting in a clear short-term consolidation trend. The medium- to long-term trend depends on the realization of key catalysts. Overall, geopolitical risks and extreme weather provide bottom support, while expectations of a global supply surplus limit upside potential. The market is awaiting clear direction from key variables such as the OPEC+ meeting and inventory data.
Institutional Outlook: The Interplay Between Supply and Demand Expectations and Policy Guidance
The latest Short-Term Energy Outlook from the U.S. Energy Information Administration (EIA) projects the average price of WTI crude oil in 2026 to be $52 per barrel. This forecast is based on the core expectation of global oil production exceeding demand and continued inventory accumulation, casting a shadow over the medium- to long-term oil price trend. Goldman Sachs holds a similar view, believing that a global supply surplus in 2026 will drive oil prices gradually downward, but geopolitical uncertainties in regions such as Iran and Venezuela may provide support for maintaining a short-term risk premium in oil prices.
Jarand Rystad, CEO of Rystad Energy, warned that if OPEC+ chooses to expand its market share, oil prices could fall sharply to the $40/barrel range, directly resulting in a 400,000 barrel/day reduction in US shale oil production. Fortunately, the market widely expects OPEC+ to maintain current production levels at its February 1st meeting. This decision is expected to limit additional supply entering the market, providing further support for short-term oil prices.
Overall, Brent crude oil prices are likely to remain range-bound unless there are signs of further escalation in the Iranian situation. Morningstar DBRS maintains its 2026 WTI crude oil price forecast of $60/barrel, arguing that geopolitical risks have partially offset concerns about the negative impact of increased global trade barriers and production growth.
Supply-side disturbances: Multiple factors cross-hedging
Overnight, market focus shifted to the recovery of Kazakhstan's crude oil supply. The country's Energy Ministry revealed on Monday that it is pushing forward with the resumption of production at its largest oil field, although industry sources indicate that current output remains low. The Tengiz oil field is expected to restart soon, and the Caspian Pipeline Union (CPC) has also restored full-capacity loading at its Black Sea terminal. This positive development on the supply side, against the backdrop of relatively ample global supply, may put downward pressure on oil prices; however, production disruptions in parts of the United States have partially offset this impact.
The latest EIA data shows that U.S. commercial crude oil inventories increased by 3.6 million barrels last week, far exceeding market expectations of a 1.7 million barrel decrease; gasoline inventories also increased by 4.2 million barrels, pushing overall inventory levels close to a five-year high. A report released by the American Petroleum Institute (API) also confirmed the signal of oversupply, with crude oil inventories increasing by 2.4 million barrels and gasoline inventories increasing by 3.1 million barrels. These two sets of data further reinforced market concerns about ample supply.
Energy Aspects noted that production disruptions peaked at 1.5 million barrels per day on Saturday, primarily concentrated in the Permian Basin. The decline narrowed to 700,000 barrels per day on Monday, and full recovery is expected by January 30th. While this short-term supply disruption is unlikely to alter the medium- to long-term trend, it effectively limited the decline in oil prices. The weather-driven disruptions in US production, coupled with the recovery in supply from Kazakhstan, offset each other, providing crucial support for oil prices around $60.
Refinery Disturbances and Geopolitical Support: The Impact of Marginal Variables
Refinery disruptions and changes in inventory expectations have also become important variables affecting oil prices. Several refineries along the US Gulf Coast experienced operational problems due to freezing weather, raising concerns about fuel supply disruptions. Meanwhile, some believed that crude oil inventories might decline significantly in the coming weeks, an expectation that could support oil prices. However, the latest EIA report showed an actual increase in inventories, undoubtedly challenging this optimistic expectation. The current stubborn accumulation of US inventories continues to dominate market sentiment, even with increased geopolitical disturbances.
The peace talks between Russia and Ukraine failed to achieve a substantial breakthrough last weekend, and both sides agreed to continue consultations next weekend. This development may further affect the dynamics of the global energy market, and we need to continue to pay attention to the marginal changes brought about by the negotiation process.
Tensions in the Middle East have provided potential underlying support for oil prices. Despite relatively subdued market sentiment in recent days, supply concerns stemming from geopolitical risks have not dissipated following President Trump's deployment of naval assets to the region. However, while geopolitical risks objectively exist, there are currently no clear signs of escalation or imminent disruption. The risk premium arising from tensions with Iran and policy changes in Venezuela is insufficient to offset the pressure from supply fundamentals, making a sustained rise in oil prices unlikely.
Ole S. Hansen, head of commodity strategy, believes that the recent rebound in crude oil prices is driven more by short covering and momentum than by a substantial improvement in fundamentals. He expects limited upside potential for WTI crude oil, with resistance likely around $65.
Rystad Energy geopolitical analyst Jorge Leon emphasized that current market trends are more driven by political uncertainty than by traditional supply and demand fundamentals. OPEC+ continues to prioritize stability in its policy-making, and this orientation will also affect the balance of the global crude oil market.
Technical Analysis: Key Moving Averages Dominate the Trading Range
Technical analysis shows that WTI crude oil remains in a consolidation range in the short term. Currently, the price is around $60.82, slightly above the 50-day moving average of $58.64, but still below the key 200-day moving average of $62.22, indicating that the bulls have not yet broken through this long-term key resistance level. Looking at recent price action, although there has been a rebound, it has failed to effectively break through the previous high of $62.20, indicating significant selling pressure above.
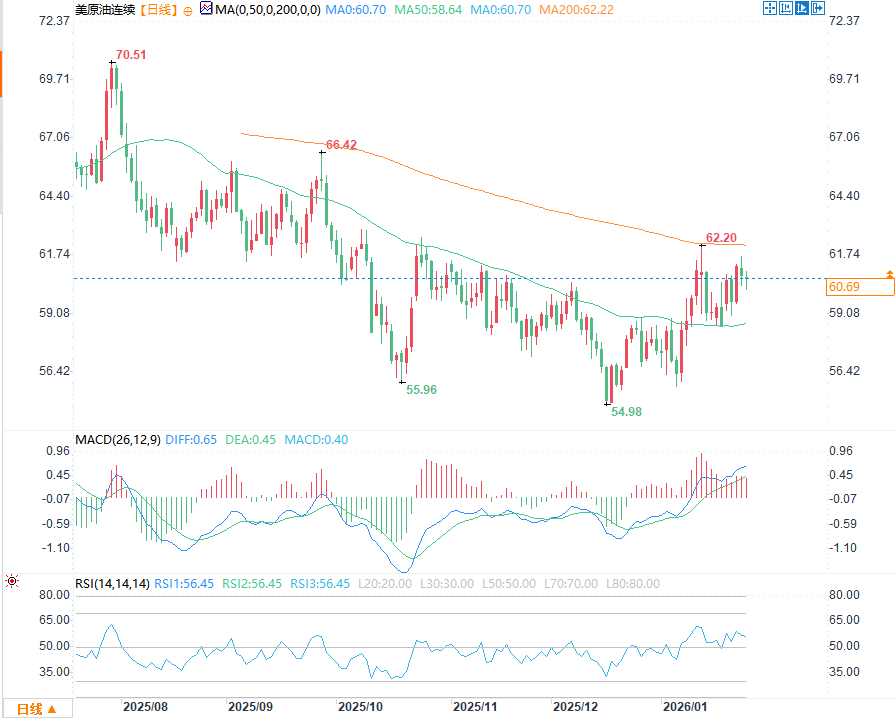
(WTI crude oil daily chart source: FX678)
From a technical perspective, the MACD indicator shows that bullish momentum has strengthened, with the DIFF line at 0.66 and the DEA line at 0.46. The MACD histogram is gradually shortening, but whether the bullish strength can continue to expand remains to be seen. The RSI indicator is around 57, in a neutral-to-bullish range, and has not yet entered overbought territory, indicating that it still retains some upward momentum in the short term. Overall, the price is currently oscillating between the 50-day and 200-day moving averages, and the bullish trend has not yet been fully established. Whether it can break through the 200-day moving average of $62.22 will be the key to confirming the medium-term upward trend.
Market traders are divided: Namzes points out that prices have retraced to 50% of the level between the COVID-19 low and the 2022 peak, and briefly broke through the 200-day moving average. The tightening of the monthly Bollinger Bands suggests a possible expansionary trend, with the potential to reach new highs in 2028 in the long term. ASX Trader David Bird, on the other hand, believes that if prices can return above $70, a larger upward trend may begin, but he is currently more inclined to expect resistance in the $64-$70 range.
From a downside risk perspective, Fibonacci analysis suggests that if the price breaks below the key 0.786 level, it could potentially test the $43-$45 range, or even experience a deeper correction. As for support, the 50-day exponential moving average (EMA) coincides with the support level, and buyers are currently actively defending this area, making it a crucial short-term support level.
Summary: The market is consolidating and awaiting a breakout; focus on key turning points.
In summary, WTI crude oil is likely to maintain a volatile pattern in the short term. Supply disruptions and geopolitical risks provide support at the bottom, but expectations of a global supply surplus continue to limit upside potential. For investors, close attention should be paid to the OPEC+ meeting decision and changes in inventory data, as these two factors may become the core variables that break the current volatile pattern and trigger a turning point in the market.
WTI crude oil is currently in a complex situation with intertwined bullish and bearish factors. Supply-side uncertainties and key technical resistance levels are creating a dual struggle, resulting in a clear short-term consolidation trend. The medium- to long-term trend depends on the realization of key catalysts. Overall, geopolitical risks and extreme weather provide bottom support, while expectations of a global supply surplus limit upside potential. The market is awaiting clear direction from key variables such as the OPEC+ meeting and inventory data.
Institutional Outlook: The Interplay Between Supply and Demand Expectations and Policy Guidance
The latest Short-Term Energy Outlook from the U.S. Energy Information Administration (EIA) projects the average price of WTI crude oil in 2026 to be $52 per barrel. This forecast is based on the core expectation of global oil production exceeding demand and continued inventory accumulation, casting a shadow over the medium- to long-term oil price trend. Goldman Sachs holds a similar view, believing that a global supply surplus in 2026 will drive oil prices gradually downward, but geopolitical uncertainties in regions such as Iran and Venezuela may provide support for maintaining a short-term risk premium in oil prices.
Jarand Rystad, CEO of Rystad Energy, warned that if OPEC+ chooses to expand its market share, oil prices could fall sharply to the $40/barrel range, directly resulting in a 400,000 barrel/day reduction in US shale oil production. Fortunately, the market widely expects OPEC+ to maintain current production levels at its February 1st meeting. This decision is expected to limit additional supply entering the market, providing further support for short-term oil prices.
Overall, Brent crude oil prices are likely to remain range-bound unless there are signs of further escalation in the Iranian situation. Morningstar DBRS maintains its 2026 WTI crude oil price forecast of $60/barrel, arguing that geopolitical risks have partially offset concerns about the negative impact of increased global trade barriers and production growth.
Supply-side disturbances: Multiple factors cross-hedging
Overnight, market focus shifted to the recovery of Kazakhstan's crude oil supply. The country's Energy Ministry revealed on Monday that it is pushing forward with the resumption of production at its largest oil field, although industry sources indicate that current output remains low. The Tengiz oil field is expected to restart soon, and the Caspian Pipeline Union (CPC) has also restored full-capacity loading at its Black Sea terminal. This positive development on the supply side, against the backdrop of relatively ample global supply, may put downward pressure on oil prices; however, production disruptions in parts of the United States have partially offset this impact.
The latest EIA data shows that U.S. commercial crude oil inventories increased by 3.6 million barrels last week, far exceeding market expectations of a 1.7 million barrel decrease; gasoline inventories also increased by 4.2 million barrels, pushing overall inventory levels close to a five-year high. A report released by the American Petroleum Institute (API) also confirmed the signal of oversupply, with crude oil inventories increasing by 2.4 million barrels and gasoline inventories increasing by 3.1 million barrels. These two sets of data further reinforced market concerns about ample supply.
Energy Aspects noted that production disruptions peaked at 1.5 million barrels per day on Saturday, primarily concentrated in the Permian Basin. The decline narrowed to 700,000 barrels per day on Monday, and full recovery is expected by January 30th. While this short-term supply disruption is unlikely to alter the medium- to long-term trend, it effectively limited the decline in oil prices. The weather-driven disruptions in US production, coupled with the recovery in supply from Kazakhstan, offset each other, providing crucial support for oil prices around $60.
Refinery Disturbances and Geopolitical Support: The Impact of Marginal Variables
Refinery disruptions and changes in inventory expectations have also become important variables affecting oil prices. Several refineries along the US Gulf Coast experienced operational problems due to freezing weather, raising concerns about fuel supply disruptions. Meanwhile, some believed that crude oil inventories might decline significantly in the coming weeks, an expectation that could support oil prices. However, the latest EIA report showed an actual increase in inventories, undoubtedly challenging this optimistic expectation. The current stubborn accumulation of US inventories continues to dominate market sentiment, even with increased geopolitical disturbances.
The peace talks between Russia and Ukraine failed to achieve a substantial breakthrough last weekend, and both sides agreed to continue consultations next weekend. This development may further affect the dynamics of the global energy market, and we need to continue to pay attention to the marginal changes brought about by the negotiation process.
Tensions in the Middle East have provided potential underlying support for oil prices. Despite relatively subdued market sentiment in recent days, supply concerns stemming from geopolitical risks have not dissipated following President Trump's deployment of naval assets to the region. However, while geopolitical risks objectively exist, there are currently no clear signs of escalation or imminent disruption. The risk premium arising from tensions with Iran and policy changes in Venezuela is insufficient to offset the pressure from supply fundamentals, making a sustained rise in oil prices unlikely.
Ole S. Hansen, head of commodity strategy, believes that the recent rebound in crude oil prices is driven more by short covering and momentum than by a substantial improvement in fundamentals. He expects limited upside potential for WTI crude oil, with resistance likely around $65.
Rystad Energy geopolitical analyst Jorge Leon emphasized that current market trends are more driven by political uncertainty than by traditional supply and demand fundamentals. OPEC+ continues to prioritize stability in its policy-making, and this orientation will also affect the balance of the global crude oil market.
Technical Analysis: Key Moving Averages Dominate the Trading Range
Technical analysis shows that WTI crude oil remains in a consolidation range in the short term. Currently, the price is around $60.82, slightly above the 50-day moving average of $58.64, but still below the key 200-day moving average of $62.22, indicating that the bulls have not yet broken through this long-term key resistance level. Looking at recent price action, although there has been a rebound, it has failed to effectively break through the previous high of $62.20, indicating significant selling pressure above.
(WTI crude oil daily chart source: FX678)
From a technical perspective, the MACD indicator shows that bullish momentum has strengthened, with the DIFF line at 0.66 and the DEA line at 0.46. The MACD histogram is gradually shortening, but whether the bullish strength can continue to expand remains to be seen. The RSI indicator is around 57, in a neutral-to-bullish range, and has not yet entered overbought territory, indicating that it still retains some upward momentum in the short term. Overall, the price is currently oscillating between the 50-day and 200-day moving averages, and the bullish trend has not yet been fully established. Whether it can break through the 200-day moving average of $62.22 will be the key to confirming the medium-term upward trend.
Market traders are divided: Namzes points out that prices have retraced to 50% of the level between the COVID-19 low and the 2022 peak, and briefly broke through the 200-day moving average. The tightening of the monthly Bollinger Bands suggests a possible expansionary trend, with the potential to reach new highs in 2028 in the long term. ASX Trader David Bird, on the other hand, believes that if prices can return above $70, a larger upward trend may begin, but he is currently more inclined to expect resistance in the $64-$70 range.
From a downside risk perspective, Fibonacci analysis suggests that if the price breaks below the key 0.786 level, it could potentially test the $43-$45 range, or even experience a deeper correction. As for support, the 50-day exponential moving average (EMA) coincides with the support level, and buyers are currently actively defending this area, making it a crucial short-term support level.
Summary: The market is consolidating and awaiting a breakout; focus on key turning points.
In summary, WTI crude oil is likely to maintain a volatile pattern in the short term. Supply disruptions and geopolitical risks provide support at the bottom, but expectations of a global supply surplus continue to limit upside potential. For investors, close attention should be paid to the OPEC+ meeting decision and changes in inventory data, as these two factors may become the core variables that break the current volatile pattern and trigger a turning point in the market.
- Risk Warning and Disclaimer
- The market involves risk, and trading may not be suitable for all investors. This article is for reference only and does not constitute personal investment advice, nor does it take into account certain users’ specific investment objectives, financial situation, or other needs. Any investment decisions made based on this information are at your own risk.