Two forces are tearing oil prices apart: a multi-billion dollar tug-of-war is entering its final countdown.
2026-02-07 20:45:05
The international crude oil market experienced significant volatility during the week of February 2nd-6th, with bulls and bears engaged in a fierce battle at high levels. The interplay of recurring geopolitical tensions and weak US economic data forced traders to grapple with a difficult choice between supply risks and demand concerns. Although the weekly chart showed a decline, ending a six-week winning streak, Friday's rebound and the typical technical pattern presented on the weekly candlestick chart suggest that the next phase of the market may face a directional decision.

This week, the prices of the two major international benchmark crude oils experienced a rollercoaster ride, with significantly increased volatility.
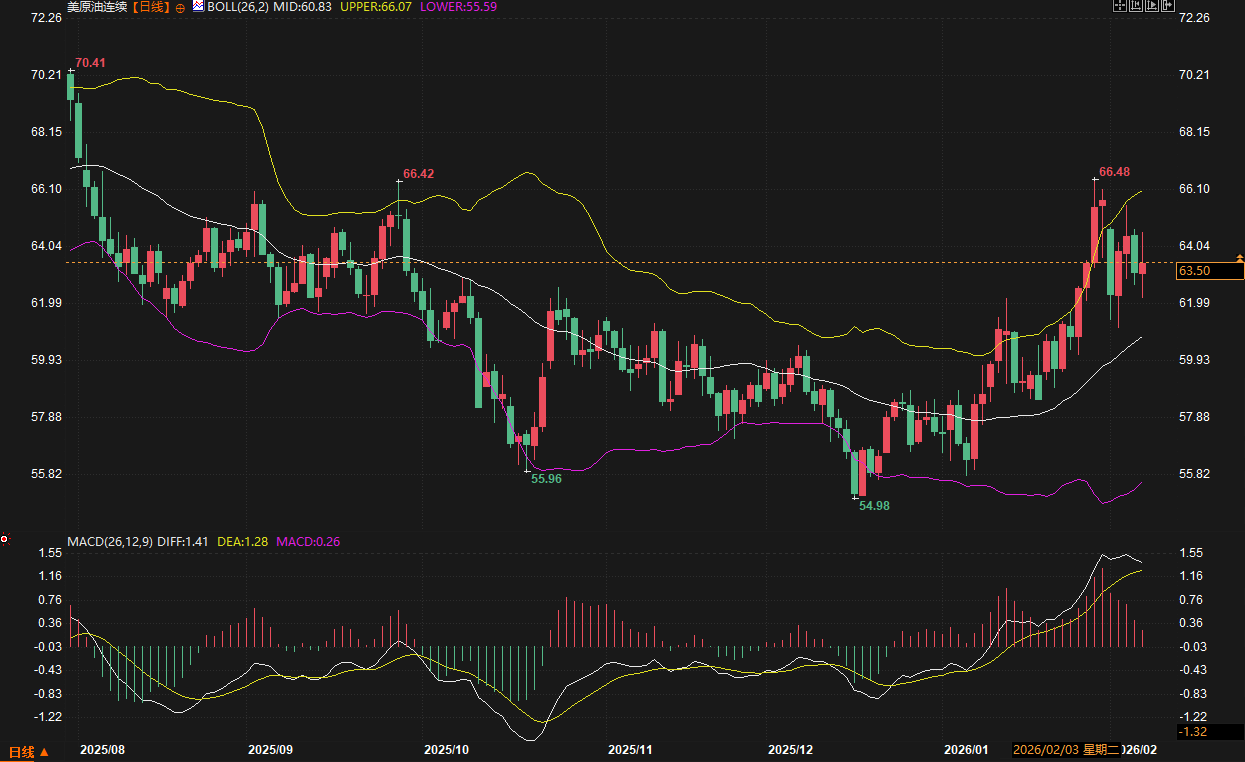
US WTI crude oil futures prices opened the week with a sharp drop, plunging more than 5% on Monday, marking the largest single-day decline in recent times. However, the decline did not last, with oil prices rebounding rapidly on Tuesday and Wednesday, almost recovering all the losses from the beginning of the week. This strength failed to continue into Thursday, when oil prices fell again by more than 2%. On Friday, market sentiment reversed again, and oil prices stubbornly closed higher after falling during the session. Ultimately, WTI crude oil fell 3.14% for the week, ending its continuous upward trend since the end of last year.
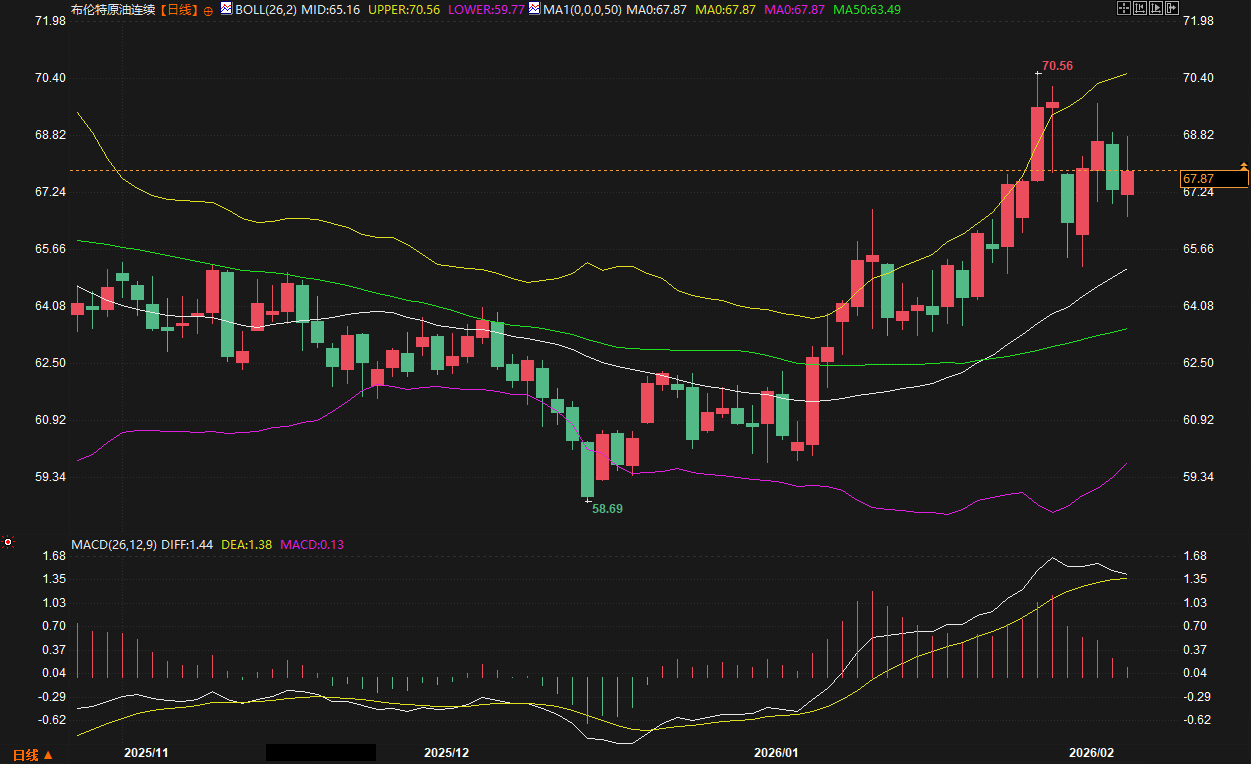
Brent crude futures moved largely in tandem with WTI. They also fell sharply by nearly 5% on Monday, before rebounding 2.3% and 1.1% on Tuesday and Wednesday respectively. After turning lower on Thursday, they closed higher on Friday, following WTI's lead.
More importantly, from a technical perspective, the weekly candlestick chart for WTI crude oil shows a classic "long-legged doji." This candlestick has a very small body (almost a horizontal line) but is accompanied by very long upper and lower shadows. This pattern is a classic signal that the forces of buyers and sellers in the market have reached a temporary balance at the current level, indicating a heated battle. It usually foreshadows the exhaustion of the momentum of the existing trend and a potential major reversal. Traders are generally paying attention: if the closing price of the next candlestick is lower than the body of the doji, it may confirm a downtrend reversal; conversely, if the closing price is higher than the body, it indicates that the current uptrend may be respited and continue.
The dramatic fluctuations in the oil market this week were mainly due to the back-and-forth struggle between two core forces:
1. US-Iran Negotiations: A Geopolitical "Electrocardiogram" of Fluctuations
This week, the market's primary focus has remained on the indirect negotiations between Iran and the United States in Oman. These talks aim to bridge the sharp differences between the two sides over Iran's nuclear program. The inherent uncertainty of the negotiation process acts like an electrocardiogram, affecting every nerve in oil prices.
Concerns about escalating agenda disagreements: Prior to the talks, fundamental contradictions in the agendas of the two sides—Iran wanted to focus on the nuclear issue, while the US wanted to include discussions on Iran's ballistic missile program and its regional influence—led to persistent market anxieties about a breakdown in negotiations and escalating tensions. As a crucial chokepoint for global oil transportation, disruption to the Strait of Hormuz due to a US-Iran conflict would directly threaten approximately one-fifth of global oil consumption, a core source of the risk premium supporting oil prices.
The negotiations have repeatedly roiled the market: John Kirdoff, a partner at Again Capital, aptly described this market condition: "The situation in Iran has always been volatile. Sometimes it looks better for a day, or even an hour, and then it gets worse again. Tensions about Iran have become the norm." Friday's rebound in oil prices stemmed from renewed concerns among traders that the US-Iran negotiations had failed to effectively reduce the risk of military conflict. The Iranian Foreign Minister's statement after the negotiations that his representatives would return home for further consultations and that negotiations would continue in the future did not bring certainty to the market; instead, it reinforced the uncertainty of the situation.
Market logic: Any positive signs in negotiations will put downward pressure on oil prices (easing the risk of supply disruptions), while any signs of a stalemate or deterioration will push prices up. This week's significant price volatility is a direct reflection of this real-time shift in sentiment.
2. Economic Data and Supply Events: A Cold Reaction to the Market
Aside from geopolitical risks, news from fundamentals mainly played a negative role.
US economic data fuels demand concerns: This week's US labor market data showed signs of weakness, including higher-than-expected initial jobless claims and job openings falling to multi-year lows. This data has exacerbated market concerns about a slowdown in the economy of the world's largest oil consumer. This economic slowdown directly points to weak oil demand, which contrasts with the supply premium resulting from geopolitical risks.
Limited Impact of Kazakhstan Supply Disruption: Reports indicate that Kazakhstan's planned crude oil exports via the Russian route this month may be significantly reduced due to slow recovery at the Tengiz oil field following a fire. This event should have provided supply-side support, but its impact was overshadowed by broader economic concerns and geopolitical uncertainties, failing to prevent oil prices from closing lower for the week.
Faced with such a complex and rapidly changing market environment, analysts' views also focus on assessing risks and uncertainties.
John Kirdoff, a partner at Again Capital, represents the prevailing market sentiment that the Iranian issue has become a persistent "background noise" risk, whose volatile nature makes oil prices highly susceptible to impulsive fluctuations.
Most market observers believe that oil prices are currently at a critical crossroads. On the one hand, geopolitical risk premiums, especially the unpredictability of US-Iran relations, provide a solid floor for oil prices. Any possibility of conflict could quickly push prices up. On the other hand, the gloomy macroeconomic outlook, particularly the concerns about an economic recession implied by increased market expectations of a Federal Reserve rate cut, constitutes a ceiling suppressing further increases in oil prices.
Technical analysts are paying particular attention to the "long-legged doji" weekly candlestick pattern that formed this week. They point out that this pattern is a clear technical signal of market hesitation and weakening trend strength. While it doesn't directly indicate direction, it suggests that upcoming price volatility could be very sharp and sets the tone for the next medium-term trend. Traders are closely watching next week's closing price to confirm whether it will break down or resume its upward trend.
In summary, the crude oil market during the week of February 2nd to 6th perfectly illustrated how market sentiment can be torn apart by conflicting information near historical highs. Geopolitical "powder kegs" and economic slowdowns jointly orchestrated this wide-ranging volatility. The "long-legged doji" candlestick pattern on the weekly chart is a technical snapshot of this extreme confrontation between bulls and bears.
Looking ahead, the short-term path of oil prices will still depend on the evolution of two major variables: first, the next phase of the "US-Iran risk electrocardiogram," where any substantial progress in negotiations or escalation of military posture will trigger a sharp market reaction; and second, the performance of macroeconomic data, especially US economic data, which will determine the weight of demand-side concerns. Traders need to prepare for continued high volatility, as the market awaits a strong catalyst to break the current fragile balance at high levels, determining whether a deep downward correction will occur or a move towards higher levels after digesting negative news. Until the situation becomes clearer, this precarious, oscillating pattern is likely to remain the dominant theme.
This Week's Market Recap: A Fierce Battle Between Bulls and Bears at High Levels
This week, the prices of the two major international benchmark crude oils experienced a rollercoaster ride, with significantly increased volatility.
US WTI crude oil futures prices opened the week with a sharp drop, plunging more than 5% on Monday, marking the largest single-day decline in recent times. However, the decline did not last, with oil prices rebounding rapidly on Tuesday and Wednesday, almost recovering all the losses from the beginning of the week. This strength failed to continue into Thursday, when oil prices fell again by more than 2%. On Friday, market sentiment reversed again, and oil prices stubbornly closed higher after falling during the session. Ultimately, WTI crude oil fell 3.14% for the week, ending its continuous upward trend since the end of last year.
Brent crude futures moved largely in tandem with WTI. They also fell sharply by nearly 5% on Monday, before rebounding 2.3% and 1.1% on Tuesday and Wednesday respectively. After turning lower on Thursday, they closed higher on Friday, following WTI's lead.
More importantly, from a technical perspective, the weekly candlestick chart for WTI crude oil shows a classic "long-legged doji." This candlestick has a very small body (almost a horizontal line) but is accompanied by very long upper and lower shadows. This pattern is a classic signal that the forces of buyers and sellers in the market have reached a temporary balance at the current level, indicating a heated battle. It usually foreshadows the exhaustion of the momentum of the existing trend and a potential major reversal. Traders are generally paying attention: if the closing price of the next candlestick is lower than the body of the doji, it may confirm a downtrend reversal; conversely, if the closing price is higher than the body, it indicates that the current uptrend may be respited and continue.
Key driving factors: Geopolitical risk "electrocardiogram" and demand concerns "cold water".
The dramatic fluctuations in the oil market this week were mainly due to the back-and-forth struggle between two core forces:
1. US-Iran Negotiations: A Geopolitical "Electrocardiogram" of Fluctuations
This week, the market's primary focus has remained on the indirect negotiations between Iran and the United States in Oman. These talks aim to bridge the sharp differences between the two sides over Iran's nuclear program. The inherent uncertainty of the negotiation process acts like an electrocardiogram, affecting every nerve in oil prices.
Concerns about escalating agenda disagreements: Prior to the talks, fundamental contradictions in the agendas of the two sides—Iran wanted to focus on the nuclear issue, while the US wanted to include discussions on Iran's ballistic missile program and its regional influence—led to persistent market anxieties about a breakdown in negotiations and escalating tensions. As a crucial chokepoint for global oil transportation, disruption to the Strait of Hormuz due to a US-Iran conflict would directly threaten approximately one-fifth of global oil consumption, a core source of the risk premium supporting oil prices.
The negotiations have repeatedly roiled the market: John Kirdoff, a partner at Again Capital, aptly described this market condition: "The situation in Iran has always been volatile. Sometimes it looks better for a day, or even an hour, and then it gets worse again. Tensions about Iran have become the norm." Friday's rebound in oil prices stemmed from renewed concerns among traders that the US-Iran negotiations had failed to effectively reduce the risk of military conflict. The Iranian Foreign Minister's statement after the negotiations that his representatives would return home for further consultations and that negotiations would continue in the future did not bring certainty to the market; instead, it reinforced the uncertainty of the situation.
Market logic: Any positive signs in negotiations will put downward pressure on oil prices (easing the risk of supply disruptions), while any signs of a stalemate or deterioration will push prices up. This week's significant price volatility is a direct reflection of this real-time shift in sentiment.
2. Economic Data and Supply Events: A Cold Reaction to the Market
Aside from geopolitical risks, news from fundamentals mainly played a negative role.
US economic data fuels demand concerns: This week's US labor market data showed signs of weakness, including higher-than-expected initial jobless claims and job openings falling to multi-year lows. This data has exacerbated market concerns about a slowdown in the economy of the world's largest oil consumer. This economic slowdown directly points to weak oil demand, which contrasts with the supply premium resulting from geopolitical risks.
Limited Impact of Kazakhstan Supply Disruption: Reports indicate that Kazakhstan's planned crude oil exports via the Russian route this month may be significantly reduced due to slow recovery at the Tengiz oil field following a fire. This event should have provided supply-side support, but its impact was overshadowed by broader economic concerns and geopolitical uncertainties, failing to prevent oil prices from closing lower for the week.
Institutional and analyst perspectives: Finding balance amidst uncertainty
Faced with such a complex and rapidly changing market environment, analysts' views also focus on assessing risks and uncertainties.
John Kirdoff, a partner at Again Capital, represents the prevailing market sentiment that the Iranian issue has become a persistent "background noise" risk, whose volatile nature makes oil prices highly susceptible to impulsive fluctuations.
Most market observers believe that oil prices are currently at a critical crossroads. On the one hand, geopolitical risk premiums, especially the unpredictability of US-Iran relations, provide a solid floor for oil prices. Any possibility of conflict could quickly push prices up. On the other hand, the gloomy macroeconomic outlook, particularly the concerns about an economic recession implied by increased market expectations of a Federal Reserve rate cut, constitutes a ceiling suppressing further increases in oil prices.
Technical analysts are paying particular attention to the "long-legged doji" weekly candlestick pattern that formed this week. They point out that this pattern is a clear technical signal of market hesitation and weakening trend strength. While it doesn't directly indicate direction, it suggests that upcoming price volatility could be very sharp and sets the tone for the next medium-term trend. Traders are closely watching next week's closing price to confirm whether it will break down or resume its upward trend.
Weekly Summary and Outlook
In summary, the crude oil market during the week of February 2nd to 6th perfectly illustrated how market sentiment can be torn apart by conflicting information near historical highs. Geopolitical "powder kegs" and economic slowdowns jointly orchestrated this wide-ranging volatility. The "long-legged doji" candlestick pattern on the weekly chart is a technical snapshot of this extreme confrontation between bulls and bears.
Looking ahead, the short-term path of oil prices will still depend on the evolution of two major variables: first, the next phase of the "US-Iran risk electrocardiogram," where any substantial progress in negotiations or escalation of military posture will trigger a sharp market reaction; and second, the performance of macroeconomic data, especially US economic data, which will determine the weight of demand-side concerns. Traders need to prepare for continued high volatility, as the market awaits a strong catalyst to break the current fragile balance at high levels, determining whether a deep downward correction will occur or a move towards higher levels after digesting negative news. Until the situation becomes clearer, this precarious, oscillating pattern is likely to remain the dominant theme.
- Risk Warning and Disclaimer
- The market involves risk, and trading may not be suitable for all investors. This article is for reference only and does not constitute personal investment advice, nor does it take into account certain users’ specific investment objectives, financial situation, or other needs. Any investment decisions made based on this information are at your own risk.