Gold prices plummeted by nearly $1,000, so why didn't the dollar "take off"? Keep a close eye on this policy weakness.
2026-02-02 19:50:38
On Monday (February 2nd), global financial markets experienced dramatic volatility. Spot gold prices plunged nearly 10% in early Asian and European trading, hitting a low below $4,700 per ounce. Although there was a slight rebound afterward, the daily decline still exceeded 3%. This sharp drop signifies a significant pullback of approximately $900 from the historical peak of $5,594.82 reached on January 29th, almost completely erasing the year-to-date gains. Meanwhile, the US dollar index fluctuated at relatively high levels. The boost it received last week due to the nomination of former Federal Reserve Governor Kevin Warsh as the next Fed Chair is now clashing with deep market doubts about its ability to successfully implement the "balance sheet reduction" policy. The core contradiction in the market has shifted from simple risk aversion to a complex game driven by both monetary policy expectations and changes in market liquidity.
The key anchor for the recent dollar movement has focused on the US Treasury market's expectations regarding the future balance sheet policy of the Federal Reserve. New Chairman nominee Warsh is known for advocating a significant reduction in the Fed's balance sheet. He has publicly criticized the Fed's "bloated" balance sheet for distorting the financial system and argued that reducing asset holdings would create room for lower interest rates. This policy inclination was initially interpreted by the market as a long-term positive factor for the dollar, because theoretically, quantitative tightening (QT) would reduce dollar liquidity and put upward pressure on US Treasury yields.
However, market optimism is rapidly being overshadowed by the complexities of reality. Analysts from several prominent institutions point out that substantially shrinking the Federal Reserve's current balance sheet of approximately $6.6 trillion faces near-insurmountable obstacles. The core contradiction lies in the banking system's structural dependence on ample reserves (currently around $3 trillion). Once reserves fall to near a critical level, money market interest rates will fluctuate dramatically, directly threatening the Fed's control over policy rates. This means that any aggressive balance sheet reduction could trigger financial market turmoil, contradicting the fundamental goal of maintaining market stability.
More subtly, if Warsh were to simultaneously pursue lower short-term interest rates (as the market widely expects him to favor rate cuts) and balance sheet contraction, these two actions would directly conflict in terms of financial conditions—the latter being essentially a tightening tool. Therefore, strategists at institutions like SMBC Capital Markets believe that substantial balance sheet contraction is "unworkable." A current market consensus is forming: even if Warsh intends to push for it, any changes to balance sheet policy will be extremely slow and cautious, and may require unprecedented coordination with the Treasury. This "much ado about nothing" policy outlook makes it difficult for the dollar to gain sustained unilateral upward momentum; instead, it has entered a period of high-level fluctuation due to uncertainty.
The recent plunge in gold prices, while superficially triggered by the Chicago Mercantile Exchange's (CME) increase in margin requirements for futures trading, is more fundamentally linked to the transmission effect of expectations in the bond market. The margin increase directly raised the cost of holding long positions in gold futures, forcing underfunded speculators and retail traders to liquidate their positions. This created a vicious cycle of "decline - margin calls - selling - further decline" in a rapidly falling price environment. Analysts point out that this mechanism did indeed amplify selling pressure in the short term.
However, at its core, the trigger for this sell-off was the restructuring of policy expectations following Warsh's nomination. Initially, the market saw it as a signal of potentially faster interest rate cuts, which briefly supported gold prices. But as the market delved deeper into his ambitions for balance sheet reduction, it realized that a more hawkish balance sheet policy from the Federal Reserve, even with rate cuts, could suppress gold by pushing up real interest rates and the dollar. This shift in expectations undermined the rationale behind holding gold for the medium to long term to hedge against dollar depreciation and debt monetization.
Nevertheless, this does not mean that gold's long-term safe-haven appeal has completely failed. A recent report by Barclays points out that the global interest rate cut cycle, fiscal expansion, quantitative easing trends, concerns about fiat currency credit, and the de-dollarization process may still support investment demand for gold in the future. The current plunge should be seen more as a sharp cleansing of extremely crowded long positions and a "stress test" of the market for a new, unproven Federal Reserve policy path. Gold's short-term price movement has shifted from simply reflecting safe-haven sentiment to a dual pricing of expectations regarding dollar liquidity and market structural vulnerabilities.
Technical Analysis of the US Dollar Index
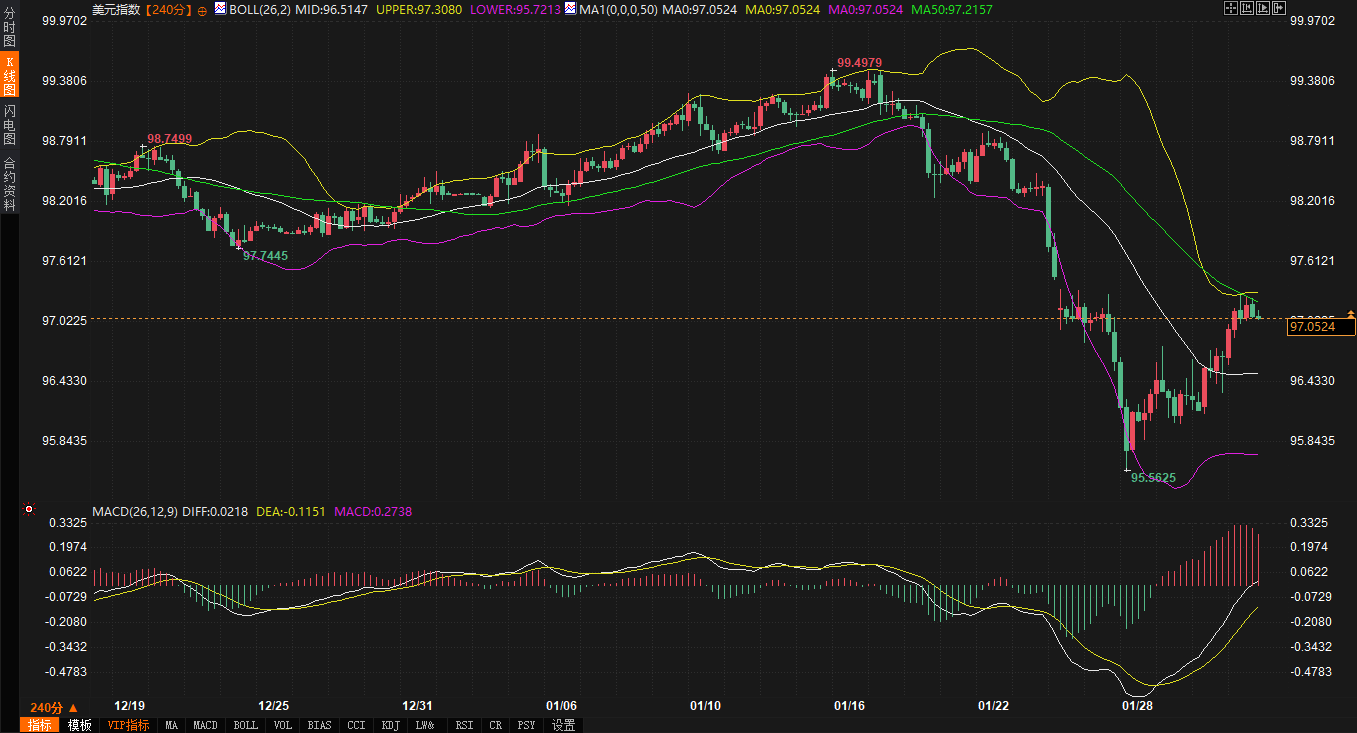
The 4-hour chart shows the US Dollar Index with the Bollinger Band middle line at 96.51, upper resistance at 97.31, and lower support at 95.72. The 50-period moving average (97.22) currently forms a key resistance level. Although the MACD indicator has crossed above the zero line, the absolute values of the DIFF and DEA lines are relatively small, and the histogram indicates a slowdown in upward momentum. The index has repeatedly tested the 97.30 area recently without a significant breakout, indicating strong selling pressure at this level. Over the next 2-3 days, the US Dollar Index is expected to oscillate within the core range of 96.50-97.30. On the upside, it's crucial to monitor whether it can hold above 97.22 (50-period moving average) and break through 97.31 (upper Bollinger Band); a breakout could open up further upside potential. On the downside, the first support level is at 96.50 (middle Bollinger Band); a break below this level could lead to a test of the 95.70-95.90 support area. During trading, close attention should be paid to fluctuations in US Treasury yields, especially the reaction of long-term Treasury bonds to any discussions about balance sheets, as this will be a key fundamental factor driving the dollar to break out of its current range.
Spot Gold Technical Analysis
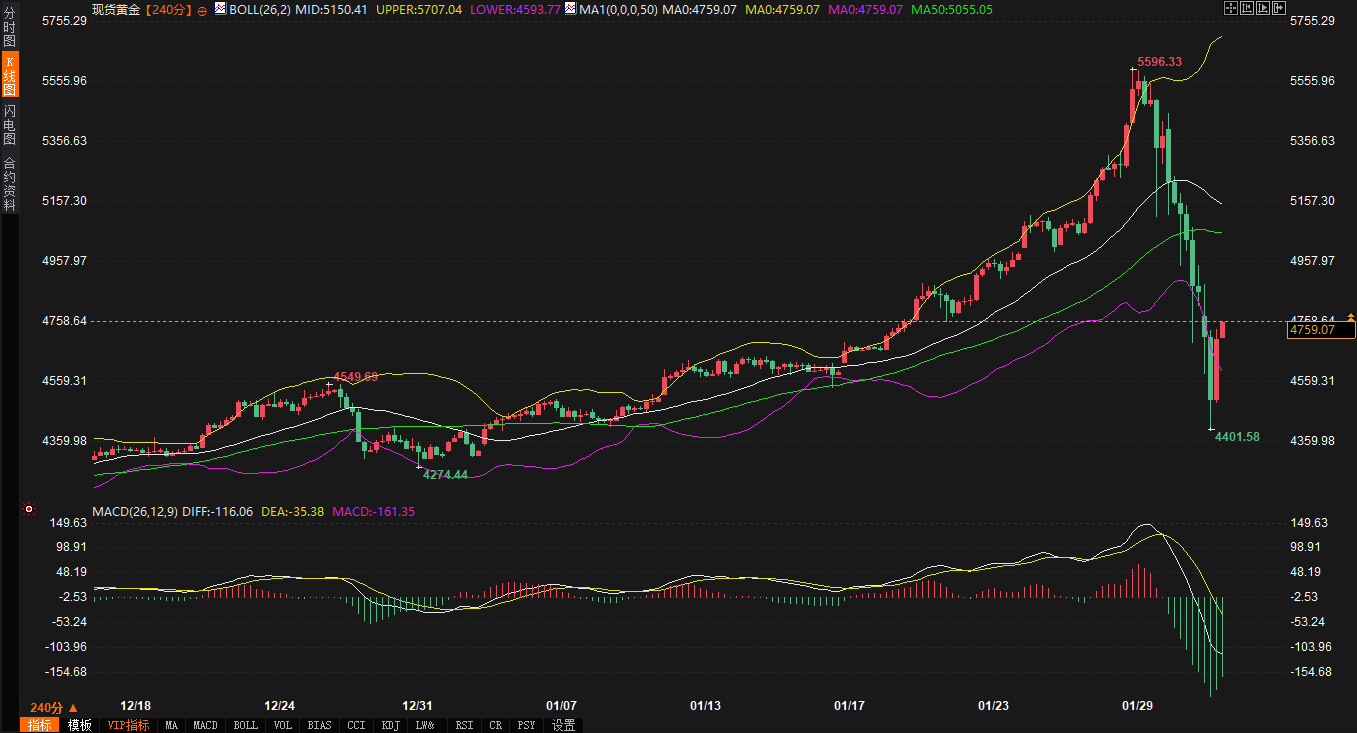
The 4-hour chart shows that after a sharp drop, gold prices have moved far from the upper Bollinger Band (5706.74) and are currently trading below the middle band (5150.57), with lower support around 4594.39. The 50-period moving average (5055.13) has become a key resistance level. The MACD indicator is below the zero line, with both the DIFF and DEA lines showing deep negative values and the histogram showing no significant convergence, indicating that bearish momentum still dominates. However, the extremely oversold condition is also brewing a technical rebound. In the next 2-3 days, gold prices are expected to enter a consolidation and correction phase after the oversold condition. The first resistance zone is located at $4800-$4850 (the recent rebound high and psychological level after the sharp drop), with stronger resistance in the $4950-$5050 area (the 50-period moving average and the previous area of high trading volume). The key support level to watch is the $4,700 psychological level. A break below this level could lead to a further decline to the $4,600-$4,650 area (near the lower Bollinger Band and the starting point of the year's upward move). Intraday focus will be on whether the CME margin increase will ease selling pressure and whether any news regarding the Fed's policy path will cause an unexpected drop in US Treasury yields, thus providing a respite for gold.
Overall Outlook : Over the next 48-72 hours, the market will be digesting the recent sharp fluctuations. The movements of both the US dollar and gold will be closely reliant on the repricing of the "Wash Policy feasibility." The US dollar lacks a strong foundation due to real-world policy constraints, while gold, after experiencing a liquidity shock, needs to reassess its value as a hedge against "monetary policy uncertainty." Both are likely to enter a period of consolidation with slightly lower volatility but unclear direction, awaiting clearer policy signals or macroeconomic data guidance. Investors should be wary of fluctuating market sentiment after extreme volatility and the impact of changes in liquidity conditions on short-term prices.
The Dilemma of US Debt Outlook: Warsh's Ambitious Balance Sheet Reduction and Market Reality
The key anchor for the recent dollar movement has focused on the US Treasury market's expectations regarding the future balance sheet policy of the Federal Reserve. New Chairman nominee Warsh is known for advocating a significant reduction in the Fed's balance sheet. He has publicly criticized the Fed's "bloated" balance sheet for distorting the financial system and argued that reducing asset holdings would create room for lower interest rates. This policy inclination was initially interpreted by the market as a long-term positive factor for the dollar, because theoretically, quantitative tightening (QT) would reduce dollar liquidity and put upward pressure on US Treasury yields.
However, market optimism is rapidly being overshadowed by the complexities of reality. Analysts from several prominent institutions point out that substantially shrinking the Federal Reserve's current balance sheet of approximately $6.6 trillion faces near-insurmountable obstacles. The core contradiction lies in the banking system's structural dependence on ample reserves (currently around $3 trillion). Once reserves fall to near a critical level, money market interest rates will fluctuate dramatically, directly threatening the Fed's control over policy rates. This means that any aggressive balance sheet reduction could trigger financial market turmoil, contradicting the fundamental goal of maintaining market stability.
More subtly, if Warsh were to simultaneously pursue lower short-term interest rates (as the market widely expects him to favor rate cuts) and balance sheet contraction, these two actions would directly conflict in terms of financial conditions—the latter being essentially a tightening tool. Therefore, strategists at institutions like SMBC Capital Markets believe that substantial balance sheet contraction is "unworkable." A current market consensus is forming: even if Warsh intends to push for it, any changes to balance sheet policy will be extremely slow and cautious, and may require unprecedented coordination with the Treasury. This "much ado about nothing" policy outlook makes it difficult for the dollar to gain sustained unilateral upward momentum; instead, it has entered a period of high-level fluctuation due to uncertainty.
The Gold Market "Stampede" and its Transmission: From Bond Market Safe-Haven Demand to Liquidity Shock
The recent plunge in gold prices, while superficially triggered by the Chicago Mercantile Exchange's (CME) increase in margin requirements for futures trading, is more fundamentally linked to the transmission effect of expectations in the bond market. The margin increase directly raised the cost of holding long positions in gold futures, forcing underfunded speculators and retail traders to liquidate their positions. This created a vicious cycle of "decline - margin calls - selling - further decline" in a rapidly falling price environment. Analysts point out that this mechanism did indeed amplify selling pressure in the short term.
However, at its core, the trigger for this sell-off was the restructuring of policy expectations following Warsh's nomination. Initially, the market saw it as a signal of potentially faster interest rate cuts, which briefly supported gold prices. But as the market delved deeper into his ambitions for balance sheet reduction, it realized that a more hawkish balance sheet policy from the Federal Reserve, even with rate cuts, could suppress gold by pushing up real interest rates and the dollar. This shift in expectations undermined the rationale behind holding gold for the medium to long term to hedge against dollar depreciation and debt monetization.
Nevertheless, this does not mean that gold's long-term safe-haven appeal has completely failed. A recent report by Barclays points out that the global interest rate cut cycle, fiscal expansion, quantitative easing trends, concerns about fiat currency credit, and the de-dollarization process may still support investment demand for gold in the future. The current plunge should be seen more as a sharp cleansing of extremely crowded long positions and a "stress test" of the market for a new, unproven Federal Reserve policy path. Gold's short-term price movement has shifted from simply reflecting safe-haven sentiment to a dual pricing of expectations regarding dollar liquidity and market structural vulnerabilities.
Technical Range and Outlook for the Next 2-3 Days: Market Volatility and Correction to Dominate
Technical Analysis of the US Dollar Index
The 4-hour chart shows the US Dollar Index with the Bollinger Band middle line at 96.51, upper resistance at 97.31, and lower support at 95.72. The 50-period moving average (97.22) currently forms a key resistance level. Although the MACD indicator has crossed above the zero line, the absolute values of the DIFF and DEA lines are relatively small, and the histogram indicates a slowdown in upward momentum. The index has repeatedly tested the 97.30 area recently without a significant breakout, indicating strong selling pressure at this level. Over the next 2-3 days, the US Dollar Index is expected to oscillate within the core range of 96.50-97.30. On the upside, it's crucial to monitor whether it can hold above 97.22 (50-period moving average) and break through 97.31 (upper Bollinger Band); a breakout could open up further upside potential. On the downside, the first support level is at 96.50 (middle Bollinger Band); a break below this level could lead to a test of the 95.70-95.90 support area. During trading, close attention should be paid to fluctuations in US Treasury yields, especially the reaction of long-term Treasury bonds to any discussions about balance sheets, as this will be a key fundamental factor driving the dollar to break out of its current range.
Spot Gold Technical Analysis
The 4-hour chart shows that after a sharp drop, gold prices have moved far from the upper Bollinger Band (5706.74) and are currently trading below the middle band (5150.57), with lower support around 4594.39. The 50-period moving average (5055.13) has become a key resistance level. The MACD indicator is below the zero line, with both the DIFF and DEA lines showing deep negative values and the histogram showing no significant convergence, indicating that bearish momentum still dominates. However, the extremely oversold condition is also brewing a technical rebound. In the next 2-3 days, gold prices are expected to enter a consolidation and correction phase after the oversold condition. The first resistance zone is located at $4800-$4850 (the recent rebound high and psychological level after the sharp drop), with stronger resistance in the $4950-$5050 area (the 50-period moving average and the previous area of high trading volume). The key support level to watch is the $4,700 psychological level. A break below this level could lead to a further decline to the $4,600-$4,650 area (near the lower Bollinger Band and the starting point of the year's upward move). Intraday focus will be on whether the CME margin increase will ease selling pressure and whether any news regarding the Fed's policy path will cause an unexpected drop in US Treasury yields, thus providing a respite for gold.
Overall Outlook : Over the next 48-72 hours, the market will be digesting the recent sharp fluctuations. The movements of both the US dollar and gold will be closely reliant on the repricing of the "Wash Policy feasibility." The US dollar lacks a strong foundation due to real-world policy constraints, while gold, after experiencing a liquidity shock, needs to reassess its value as a hedge against "monetary policy uncertainty." Both are likely to enter a period of consolidation with slightly lower volatility but unclear direction, awaiting clearer policy signals or macroeconomic data guidance. Investors should be wary of fluctuating market sentiment after extreme volatility and the impact of changes in liquidity conditions on short-term prices.
- Risk Warning and Disclaimer
- The market involves risk, and trading may not be suitable for all investors. This article is for reference only and does not constitute personal investment advice, nor does it take into account certain users’ specific investment objectives, financial situation, or other needs. Any investment decisions made based on this information are at your own risk.