The unexpected plunge in gold prices was not caused by CME or Walsh.
2026-02-03 21:42:48
As expectations for an unexpected rate cut by Warsh, Trump's nominee for Federal Reserve Chairman, become clearer, coupled with the firm bullish outlook from institutions such as Societe Generale, the core trading logic for gold's asymmetric upward trend this year remains valid. This article once again helps readers summarize the beginning and end of this gold price drop. In addition, our previous VIP article provided a detailed analysis of the main reasons for this drop before the crash, which was still two days away from the plunge.

Last Friday, gold and silver experienced an extreme sell-off, setting a historic record for the largest single-day drop. Gold plummeted by 10%, marking its biggest intraday drop since the 2008 financial crisis and its largest single-day decline since the early 1980s. Silver, meanwhile, plunged by 30%, becoming the hardest hit sector in this round of volatility.
There are many conflicting opinions in the market. Societe Generale commodity analysts pointed out that this extreme volatility was unrelated to fundamentals, but rather a passive adjustment in the position structure. Some institutions also claimed that the crash was caused by retail investors in certain countries not understanding the principles of leveraged funds and resulting in margin calls. Others said that the CME's adjustment of margin ratios led to a lack of funds for long positions to cover their positions, causing the crash.
Another mainstream view is that Trump's announcement of nominating former Federal Reserve Governor Kevin Warsh as the next Federal Reserve Chairman led the market to misjudge Warsh's willingness to cut interest rates due to his hawkish past during the 2008-2009 financial crisis. This sentiment injected bullish momentum into the dollar, which had previously hit multi-year lows, becoming a direct driver of the decline in precious metals. However, this cannot actually be the reason for the sharp drop, because it cannot explain why gold prices did not fall when Warsh was the most popular candidate in the market. So what is the reason? I was fortunate enough to analyze it in detail in a previous VIP article.
First of all, the claim that the CME futures company's adjustment of margin requirements caused a market crash is nonsense. While it's true that the CME increased the margin requirement for gold from 6% to 8% and for silver from 11% to 15%, which would indeed make it difficult for long positions to cover after the decline, the CME's announcement was made after the market closed on January 30th, meaning that gold had already fallen by more than 10% and silver by more than 35% that day. Due to the significant fluctuations in gold and silver prices after the market closed, the CME adjusted the margin requirements, which took effect on Monday.
However, the extreme overbought condition in the precious metals market amplified the impact of negative signals. In a low-liquidity environment, excessively stretched open positions triggered a chain reaction: stop-loss orders were executed in a concentrated manner, margin calls surged, and systemic funds were forced to initiate risk reduction processes. The sharp decline in silver prices is a typical characteristic of forced liquidation of leveraged funds. Profit-taking, risk value limits being reached, CTA strategies deleveraging, and the month-end settlement effect further pushed the price decline away from the reasonable range of fundamentals. This phenomenon exists, but it is not the reason why the market chose to sell blindly; it is a consequence.
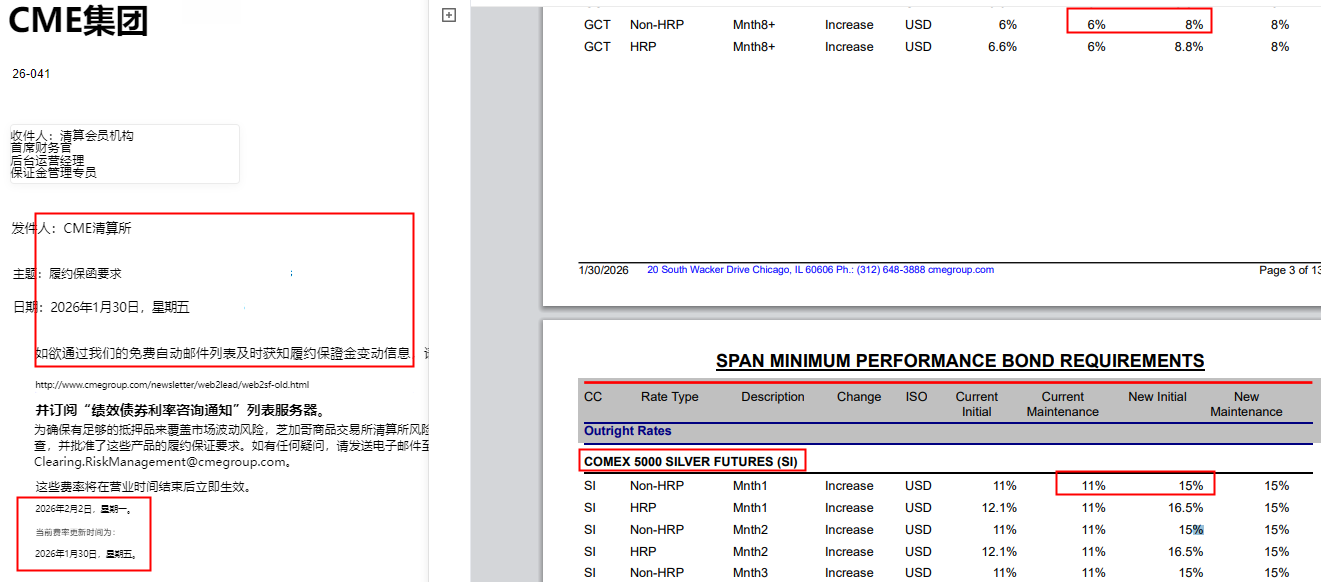
(CME Chicago Mercantile Exchange Margin Increase Notice)
Secondly, the mainstream view that Warsh's appointment caused a market crash is also inaccurate. As shown in the chart, on January 17, when the market believed that Warsh was the most likely candidate to become the next Fed chairman, gold did not fall. So why did gold fall this time after his election? This doesn't make sense.
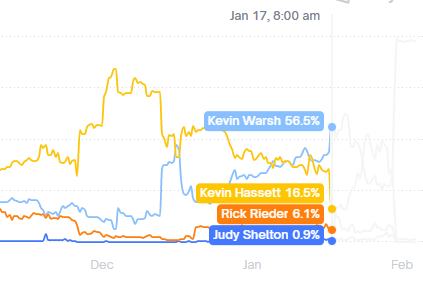
(Gold prices did not fall during the period when Warsh's nomination probability was highest)
It's worth noting that gold experienced two days of significant gains on January 27th and 28th. If the reasons for this surge are overturned, wouldn't it easily turn into a sharp drop?
Let's review what happened in the past two days. One key event was the announcement that the US government might shut down again. On January 25, the probability of a government shutdown suddenly rose to 70%, which triggered a risk aversion.
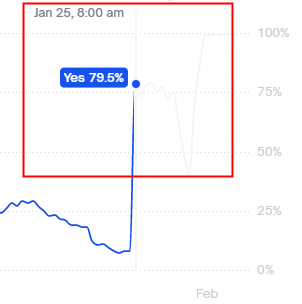
(Probability of US government shutdown surges)
Meanwhile, Warsh's chances of becoming the Fed candidate plummeted, while Reid, a bond fund manager, became the most likely candidate.
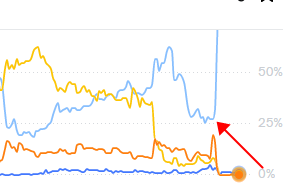
(Wash's stock price surged suddenly after Trump hinted at it and announced it the following day, exceeding overall market expectations.)
Meanwhile, there has been progress in the US shutdown. By separating funding from the Department of Homeland Security, it has been confirmed that there will be no actual shutdown and that government functions will be retained. This means that the US government will at most have a superficial shutdown because it needs to go through procedures, and the risk of a shutdown has also disappeared.
The two forces that caused the surge in gold prices on January 27 and 28 suddenly disappeared. We all know what happened next. For more details, please refer to our previous articles.
Here's an important detail: On January 29th, gold actually experienced a sharp drop and rebound around 11 PM in the New York session. However, there weren't any specific negative factors that day, so gold recovered its losses by the end of the session. This wave of gold prices fell as much as -8% before rebounding to close down -1%, a rebound of 7%.
Here's the key point: During the Asian session that day, equity markets, gold stocks, and other commodities all opened higher, which was their highest point, before falling back throughout the day. It's worth noting that spot gold rose during the Asian session that day, while LME copper also surged by 5%, leading the gains. Furthermore, before gold and silver plunged in the evening, LME copper rallied to a 10% gain, enticing more buyers.
There are two explanations for this. One is that the buying frenzy in gold and silver led to all the bulls entering the market, leaving no bulls left. This caused the equity market to surge and then fall back. In the futures market, gold and silver bulls were unwilling to chase the highs, so they went to the lower-priced copper to push up prices. At this point, there were no bulls left either. Until the end of the trading day, the bears exerted their strength and the price plummeted. At this point, the bulls were willing to buy the dip. However, there were no bulls left in the market. Gold bulls who were unwilling to chase the highs or participate in the copper price rebound ultimately chose to enter the market when gold plummeted by 8%. As the saying goes, those who should have bought had already bought. There were no bulls left in the market. So, the next day, the bulls who bought yesterday were all short sellers who were preparing to take profits today, resulting in a long squeeze and a stampede-like crash.
Of course, there is another explanation, which may be closer to the truth: the futures market was manipulated to sell equity, and copper was manipulated to sell gold and silver. After the major players lured in more buyers and sold off their equity holdings, they started to dump their shares. Later that night, European and American investors saw that the equity market was selling off during the Asian session, so they chose to follow suit and sell off their shares.
This market movement has now completed its course, and it's a classic, textbook example of a market trend.
In conclusion, looking ahead, even though there is still room for further decline in gold prices, Societe Generale remains optimistic about the outlook for precious metals this year, clearly maintaining the asymmetric upside risk pattern for gold. Moreover, this bullish stance is not a temporary adjustment, but is supported by clear price expectations.
A week before this bullish statement was released, Societe Generale had already raised its gold price forecast, clarifying that reaching $6,000 per ounce by the end of the year was only a conservative estimate.
Analysts emphasize that although the uncertainty of institutional disruption at the Federal Reserve has been eliminated, the core fundamental logic for the rise in precious metals remains valid, and a healthy pullback would help the continuation of the upward trend. Short-term extreme declines will not change the long-term trend.
This judgment is also confirmed by signals from the options market. Data from gold options closely monitored by Societe Generale shows a significant asymmetry between the upside and downside potential: while the open interest of put options expiring in December 2026 with a strike price of $4,000 has increased, the open interest of call options with a strike price of $10,000 has also risen in the same period. Trading activity at the $15,000 and $20,000 price levels has also increased significantly, highlighting that the market's expectation for a long-term upward trend in gold remains.
In contrast, while the silver market exhibits similar option structure characteristics, its downside risks are more prominent: the open interest of put options expiring in March with a strike price of $75 has increased significantly, followed by contracts with strike prices of $80/oz and $90/oz, and downside hedging positions for contracts expiring in July are also accumulating significantly; while only 400 new call options have been added, reflecting the market's continued caution regarding the upside potential of silver.
In addition to the core support of interest rate cut expectations, positive news from overseas markets also alleviated panic selling in the gold market, further boosted investor confidence, and created a more stable external environment for gold trading.
On Monday, Trump announced that the United States and India had reached a trade agreement and that both sides would immediately begin to reduce tariffs on each other's goods. This positive trade news directly improved market risk appetite. At the same time, Iran and the United States are expected to resume nuclear negotiations on Friday, which has eased geopolitical uncertainties and further reduced market risk aversion. This has also allowed short-term fluctuations in the precious metals market to gradually return to rationality.
This can be interpreted as gold not falling despite negative news, because the US-India and US-Iran events are both risk events that are traditionally bearish for gold. However, the current trend of gold and equity markets rising and falling together indicates that the recovery in risk appetite is more favorable for gold bulls.
The positive impact of this expected interest rate cut will not only support gold prices but will also trigger a chain reaction in the market.
Brooks believes that if Warsh implements the expected 100 basis point rate cut, it will suppress the dollar's exchange rate—the rate cut will directly reduce the dollar's attractiveness, thereby increasing the allocation value of non-US assets such as gold and cryptocurrencies.
Overall, the logic behind the rise and fall of precious metals is becoming clearer. Whether the balance sheet reduction, driven by Warsh, will lead to higher long-term interest rates and negatively impact gold, or whether an unexpected interest rate cut will become the core driver of gold's subsequent rise, remains to be seen.
For gold trading, three key clues need to be grasped: first, the pace of interest rate cuts at the four Federal Reserve meetings from June to October, and Warsh's policy statements, which are the core variables affecting the gold price trend;
Secondly, the trend of the US dollar index, with the weakening of the dollar under the expectation of interest rate cuts, will directly benefit the price of gold.
Third, changes in the options market signals will make the asymmetric structure of gold options an important reference for trend judgment.
Meanwhile, the progress of the US-India trade agreement and the subsequent outcome of the US-Iran nuclear negotiations will also be important auxiliary factors affecting market liquidity and risk appetite; while silver, due to its higher leverage, still needs to be wary of downside risks in the short term, and its trend will still follow gold, but with greater elasticity and more violent fluctuations.
In summary, the short-term volatility in the gold market has gradually subsided, and the core trading logic has returned to expectations of interest rate cuts and fundamental support. The asymmetric upward trend remains the core theme of gold trading this year, and the short-term adjustment has also provided opportunities for long-term bullish positioning.
From a technical perspective, due to the deep decline in spot gold in this wave, the current rise has been corrected to a complete five-wave upward movement, with the fifth wave being an extended wave. Therefore, Fibonacci retracement levels have been redrawn, and the current pullback in gold aligns with this. The possibility of a new high in the short term cannot be ruled out, but it is highly likely that a considerable period of time will be needed before a new high is reached. This is because, according to wave theory, the major rise before July 2025 was a major wave one, and the current wave is a major wave three, with a further five-wave pattern to follow. Therefore, the current gold market trend is not over.
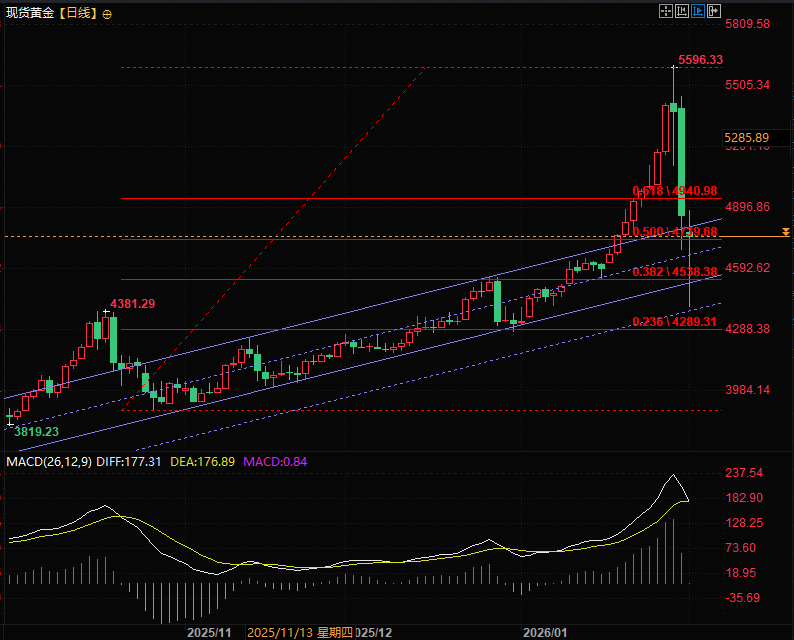
(Spot gold daily chart, source: FX678)
At 21:33 Beijing time, spot gold is trading at 4932.84.
There are many theories about the cause of the sharp drop. Is it really due to the all-powerful leveraged funds?
Last Friday, gold and silver experienced an extreme sell-off, setting a historic record for the largest single-day drop. Gold plummeted by 10%, marking its biggest intraday drop since the 2008 financial crisis and its largest single-day decline since the early 1980s. Silver, meanwhile, plunged by 30%, becoming the hardest hit sector in this round of volatility.
There are many conflicting opinions in the market. Societe Generale commodity analysts pointed out that this extreme volatility was unrelated to fundamentals, but rather a passive adjustment in the position structure. Some institutions also claimed that the crash was caused by retail investors in certain countries not understanding the principles of leveraged funds and resulting in margin calls. Others said that the CME's adjustment of margin ratios led to a lack of funds for long positions to cover their positions, causing the crash.
Another mainstream view is that Trump's announcement of nominating former Federal Reserve Governor Kevin Warsh as the next Federal Reserve Chairman led the market to misjudge Warsh's willingness to cut interest rates due to his hawkish past during the 2008-2009 financial crisis. This sentiment injected bullish momentum into the dollar, which had previously hit multi-year lows, becoming a direct driver of the decline in precious metals. However, this cannot actually be the reason for the sharp drop, because it cannot explain why gold prices did not fall when Warsh was the most popular candidate in the market. So what is the reason? I was fortunate enough to analyze it in detail in a previous VIP article.
Did CME's fee increase cause a chain reaction of margin calls in the market?
First of all, the claim that the CME futures company's adjustment of margin requirements caused a market crash is nonsense. While it's true that the CME increased the margin requirement for gold from 6% to 8% and for silver from 11% to 15%, which would indeed make it difficult for long positions to cover after the decline, the CME's announcement was made after the market closed on January 30th, meaning that gold had already fallen by more than 10% and silver by more than 35% that day. Due to the significant fluctuations in gold and silver prices after the market closed, the CME adjusted the margin requirements, which took effect on Monday.
However, the extreme overbought condition in the precious metals market amplified the impact of negative signals. In a low-liquidity environment, excessively stretched open positions triggered a chain reaction: stop-loss orders were executed in a concentrated manner, margin calls surged, and systemic funds were forced to initiate risk reduction processes. The sharp decline in silver prices is a typical characteristic of forced liquidation of leveraged funds. Profit-taking, risk value limits being reached, CTA strategies deleveraging, and the month-end settlement effect further pushed the price decline away from the reasonable range of fundamentals. This phenomenon exists, but it is not the reason why the market chose to sell blindly; it is a consequence.
(CME Chicago Mercantile Exchange Margin Increase Notice)
Is the prevailing view that Warsh's rise to power caused the gold price crash?
Secondly, the mainstream view that Warsh's appointment caused a market crash is also inaccurate. As shown in the chart, on January 17, when the market believed that Warsh was the most likely candidate to become the next Fed chairman, gold did not fall. So why did gold fall this time after his election? This doesn't make sense.
(Gold prices did not fall during the period when Warsh's nomination probability was highest)
The answer to this round of gold price decline
This article was originally intended for VIP members, but here the answer is revealed openly, and readers are encouraged to read it carefully.
It's worth noting that gold experienced two days of significant gains on January 27th and 28th. If the reasons for this surge are overturned, wouldn't it easily turn into a sharp drop?
Let's review what happened in the past two days. One key event was the announcement that the US government might shut down again. On January 25, the probability of a government shutdown suddenly rose to 70%, which triggered a risk aversion.
(Probability of US government shutdown surges)
Meanwhile, Warsh's chances of becoming the Fed candidate plummeted, while Reid, a bond fund manager, became the most likely candidate.
Importantly
, until Trump nominated Warsh, the market still believed the position should go to Reid. As shown in the chart, when Trump announced the nomination on January 30th, Warsh's probability of winning was still very low, but it subsequently jumped to 100%, a completely unexpected situation. As to how significant the expectation gap caused by the swap of the two candidates was, this involves the background stories of Reid and Warsh, and the policy tools they represented. Please refer to my previous articles for more information.(Wash's stock price surged suddenly after Trump hinted at it and announced it the following day, exceeding overall market expectations.)
Meanwhile, there has been progress in the US shutdown. By separating funding from the Department of Homeland Security, it has been confirmed that there will be no actual shutdown and that government functions will be retained. This means that the US government will at most have a superficial shutdown because it needs to go through procedures, and the risk of a shutdown has also disappeared.
The two forces that caused the surge in gold prices on January 27 and 28 suddenly disappeared. We all know what happened next. For more details, please refer to our previous articles.
The technical factors contributing to the decline in gold prices are in sync with the ongoing battle between bulls and bears.
Here's an important detail: On January 29th, gold actually experienced a sharp drop and rebound around 11 PM in the New York session. However, there weren't any specific negative factors that day, so gold recovered its losses by the end of the session. This wave of gold prices fell as much as -8% before rebounding to close down -1%, a rebound of 7%.
Here's the key point: During the Asian session that day, equity markets, gold stocks, and other commodities all opened higher, which was their highest point, before falling back throughout the day. It's worth noting that spot gold rose during the Asian session that day, while LME copper also surged by 5%, leading the gains. Furthermore, before gold and silver plunged in the evening, LME copper rallied to a 10% gain, enticing more buyers.
There are two explanations for this. One is that the buying frenzy in gold and silver led to all the bulls entering the market, leaving no bulls left. This caused the equity market to surge and then fall back. In the futures market, gold and silver bulls were unwilling to chase the highs, so they went to the lower-priced copper to push up prices. At this point, there were no bulls left either. Until the end of the trading day, the bears exerted their strength and the price plummeted. At this point, the bulls were willing to buy the dip. However, there were no bulls left in the market. Gold bulls who were unwilling to chase the highs or participate in the copper price rebound ultimately chose to enter the market when gold plummeted by 8%. As the saying goes, those who should have bought had already bought. There were no bulls left in the market. So, the next day, the bulls who bought yesterday were all short sellers who were preparing to take profits today, resulting in a long squeeze and a stampede-like crash.
Of course, there is another explanation, which may be closer to the truth: the futures market was manipulated to sell equity, and copper was manipulated to sell gold and silver. After the major players lured in more buyers and sold off their equity holdings, they started to dump their shares. Later that night, European and American investors saw that the equity market was selling off during the Asian session, so they chose to follow suit and sell off their shares.
This market movement has now completed its course, and it's a classic, textbook example of a market trend.
Institutional View: Societe Generale remains firmly bullish, expecting the asymmetric upward trend to continue throughout the year.
In conclusion, looking ahead, even though there is still room for further decline in gold prices, Societe Generale remains optimistic about the outlook for precious metals this year, clearly maintaining the asymmetric upside risk pattern for gold. Moreover, this bullish stance is not a temporary adjustment, but is supported by clear price expectations.
A week before this bullish statement was released, Societe Generale had already raised its gold price forecast, clarifying that reaching $6,000 per ounce by the end of the year was only a conservative estimate.
Analysts emphasize that although the uncertainty of institutional disruption at the Federal Reserve has been eliminated, the core fundamental logic for the rise in precious metals remains valid, and a healthy pullback would help the continuation of the upward trend. Short-term extreme declines will not change the long-term trend.
This judgment is also confirmed by signals from the options market. Data from gold options closely monitored by Societe Generale shows a significant asymmetry between the upside and downside potential: while the open interest of put options expiring in December 2026 with a strike price of $4,000 has increased, the open interest of call options with a strike price of $10,000 has also risen in the same period. Trading activity at the $15,000 and $20,000 price levels has also increased significantly, highlighting that the market's expectation for a long-term upward trend in gold remains.
In contrast, while the silver market exhibits similar option structure characteristics, its downside risks are more prominent: the open interest of put options expiring in March with a strike price of $75 has increased significantly, followed by contracts with strike prices of $80/oz and $90/oz, and downside hedging positions for contracts expiring in July are also accumulating significantly; while only 400 new call options have been added, reflecting the market's continued caution regarding the upside potential of silver.
Positive external factors: Trade agreement and nuclear negotiations finalized, boosting market risk appetite.
In addition to the core support of interest rate cut expectations, positive news from overseas markets also alleviated panic selling in the gold market, further boosted investor confidence, and created a more stable external environment for gold trading.
On Monday, Trump announced that the United States and India had reached a trade agreement and that both sides would immediately begin to reduce tariffs on each other's goods. This positive trade news directly improved market risk appetite. At the same time, Iran and the United States are expected to resume nuclear negotiations on Friday, which has eased geopolitical uncertainties and further reduced market risk aversion. This has also allowed short-term fluctuations in the precious metals market to gradually return to rationality.
This can be interpreted as gold not falling despite negative news, because the US-India and US-Iran events are both risk events that are traditionally bearish for gold. However, the current trend of gold and equity markets rising and falling together indicates that the recovery in risk appetite is more favorable for gold bulls.
The positive impact of this expected interest rate cut will not only support gold prices but will also trigger a chain reaction in the market.
Brooks believes that if Warsh implements the expected 100 basis point rate cut, it will suppress the dollar's exchange rate—the rate cut will directly reduce the dollar's attractiveness, thereby increasing the allocation value of non-US assets such as gold and cryptocurrencies.
Summary and Technical Analysis
Overall, the logic behind the rise and fall of precious metals is becoming clearer. Whether the balance sheet reduction, driven by Warsh, will lead to higher long-term interest rates and negatively impact gold, or whether an unexpected interest rate cut will become the core driver of gold's subsequent rise, remains to be seen.
For gold trading, three key clues need to be grasped: first, the pace of interest rate cuts at the four Federal Reserve meetings from June to October, and Warsh's policy statements, which are the core variables affecting the gold price trend;
Secondly, the trend of the US dollar index, with the weakening of the dollar under the expectation of interest rate cuts, will directly benefit the price of gold.
Third, changes in the options market signals will make the asymmetric structure of gold options an important reference for trend judgment.
Meanwhile, the progress of the US-India trade agreement and the subsequent outcome of the US-Iran nuclear negotiations will also be important auxiliary factors affecting market liquidity and risk appetite; while silver, due to its higher leverage, still needs to be wary of downside risks in the short term, and its trend will still follow gold, but with greater elasticity and more violent fluctuations.
In summary, the short-term volatility in the gold market has gradually subsided, and the core trading logic has returned to expectations of interest rate cuts and fundamental support. The asymmetric upward trend remains the core theme of gold trading this year, and the short-term adjustment has also provided opportunities for long-term bullish positioning.
From a technical perspective, due to the deep decline in spot gold in this wave, the current rise has been corrected to a complete five-wave upward movement, with the fifth wave being an extended wave. Therefore, Fibonacci retracement levels have been redrawn, and the current pullback in gold aligns with this. The possibility of a new high in the short term cannot be ruled out, but it is highly likely that a considerable period of time will be needed before a new high is reached. This is because, according to wave theory, the major rise before July 2025 was a major wave one, and the current wave is a major wave three, with a further five-wave pattern to follow. Therefore, the current gold market trend is not over.
(Spot gold daily chart, source: FX678)
At 21:33 Beijing time, spot gold is trading at 4932.84.
- Risk Warning and Disclaimer
- The market involves risk, and trading may not be suitable for all investors. This article is for reference only and does not constitute personal investment advice, nor does it take into account certain users’ specific investment objectives, financial situation, or other needs. Any investment decisions made based on this information are at your own risk.