Gold price forecast: The rebound target is the 4943.18–5192.81 USD retracement range.
2026-02-04 00:37:36
Spot gold surged on Tuesday (February 3), reversing the previous day's sharp decline and narrowing its weekly losses. Following Friday's plunge, buying interest returned significantly, and gold is poised for its biggest single-day gain since November 2008. At 00:08 Beijing time, spot gold was trading at $4931.35 per ounce, up 5.9%.

Institutional View: Buying on dips returns; core bullish fundamentals remain unchanged.
Investors who took profits after gold hit a record high of $5,596.33 last week are now re-entering at more attractive prices. The market recognizes that the core bullish fundamentals for gold remain intact: continued central bank gold purchases, geopolitical risks, the US debt crisis, and that gold is currently more cost-effective than it was a week ago.
Concerns about Federal Reserve policy are acting as resistance to further gains.
However, the road to further gains for gold is not smooth, with uncertainty surrounding Federal Reserve policy posing a significant obstacle. Just last week, bullish traders were confident that the Fed would cut interest rates at least twice in 2026; but with President Trump's nomination of hawkish Kevin Warsh to fill the vacancy for Fed chairman in May, gold buying immediately stalled, and bulls took the opportunity to take profits.
Prior to Warsh's nomination, higher-than-expected US Producer Price Index (PPI) data had already unsettled traders. Given that PPI directly impacts subsequent Consumer Price Index (CPI) performance, coupled with the news of Warsh's nomination, the market believes the Fed's rate cuts may be far less aggressive than previously anticipated. This directly undermines one of the core bullish logics supporting gold in 2025: the low-interest-rate environment during a rate-cutting cycle.
Without a solid support base, the rebound may be difficult to sustain.
Although gold traders have identified a support level for the current phase, any price surge is likely to be followed by a pullback without a solid support base. This suggests that investors have not learned from last week's sell-off at higher price levels.
In my opinion, if gold is to reach a new historical high this year, it must establish a solid bottom: a sideways trend in gold prices in February would be a healthy trend, and the market may see a sell-off at higher prices, something not seen for several months.
Even after a significant pullback, technical analysis suggests that the medium-term uptrend in gold remains unchanged. As long as it doesn't fall below the December low of $4,290.03, this trend assessment remains valid.
Gold prices briefly fell below the 50-day moving average before quickly recovering, indicating that investors view this moving average as a key support level and trend indicator. Historical data shows that this moving average consistently guided gold prices upwards until prices became excessively overbought later in 2025.
Technical Analysis
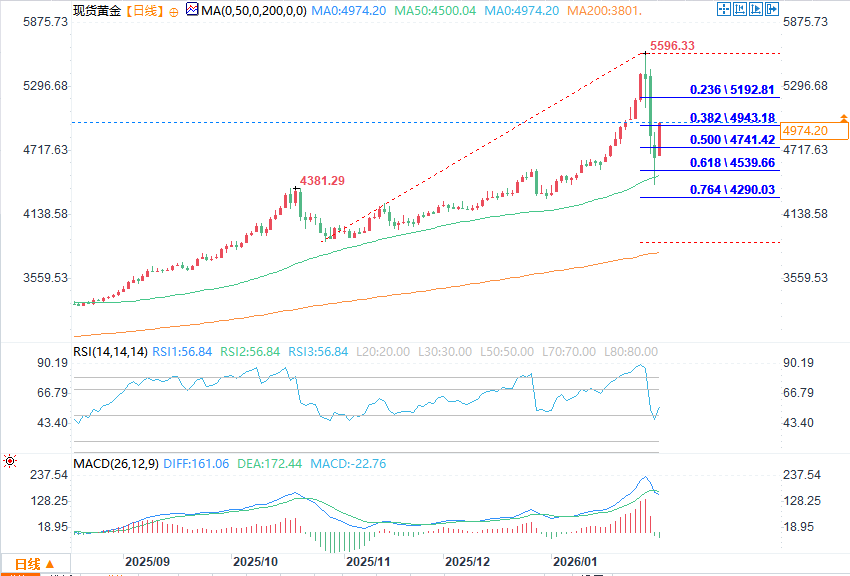
(Spot gold daily chart source: FX678)
The medium-term trading range for gold is between $3,886.51 and $5,596.33. Over the past three trading days, gold prices have found effective support at the retracement levels of $4,741.42 to $4,539.66 within this range. This range can also be defined as the core value range for gold at present, becoming an important support for the stabilization and rebound of gold prices in the short term.
The short-term fluctuation range is focused on the range of $5,596.33 (previous high) to $4,274.44 (recent low). The retracement range of $4,943.18 to $5,192.81 within this short-term range is the key upward target that needs to be watched in this round of gold rebound. Its price reaction will directly determine the sustainability of the subsequent rebound momentum.
The key focus going forward is on the price action and order flow when gold tests the $4943.18–$5192.81 range: this area will reveal whether buying pressure continues to strengthen and an upward breakout is brewing, or whether new selling/short entry will suppress the rebound and push gold prices down.
I wouldn't be surprised if sellers appear in the pullback area, because a support base hasn't formed yet.
Institutional View: Buying on dips returns; core bullish fundamentals remain unchanged.
Investors who took profits after gold hit a record high of $5,596.33 last week are now re-entering at more attractive prices. The market recognizes that the core bullish fundamentals for gold remain intact: continued central bank gold purchases, geopolitical risks, the US debt crisis, and that gold is currently more cost-effective than it was a week ago.
Concerns about Federal Reserve policy are acting as resistance to further gains.
However, the road to further gains for gold is not smooth, with uncertainty surrounding Federal Reserve policy posing a significant obstacle. Just last week, bullish traders were confident that the Fed would cut interest rates at least twice in 2026; but with President Trump's nomination of hawkish Kevin Warsh to fill the vacancy for Fed chairman in May, gold buying immediately stalled, and bulls took the opportunity to take profits.
Prior to Warsh's nomination, higher-than-expected US Producer Price Index (PPI) data had already unsettled traders. Given that PPI directly impacts subsequent Consumer Price Index (CPI) performance, coupled with the news of Warsh's nomination, the market believes the Fed's rate cuts may be far less aggressive than previously anticipated. This directly undermines one of the core bullish logics supporting gold in 2025: the low-interest-rate environment during a rate-cutting cycle.
Without a solid support base, the rebound may be difficult to sustain.
Although gold traders have identified a support level for the current phase, any price surge is likely to be followed by a pullback without a solid support base. This suggests that investors have not learned from last week's sell-off at higher price levels.
In my opinion, if gold is to reach a new historical high this year, it must establish a solid bottom: a sideways trend in gold prices in February would be a healthy trend, and the market may see a sell-off at higher prices, something not seen for several months.
Even after a significant pullback, technical analysis suggests that the medium-term uptrend in gold remains unchanged. As long as it doesn't fall below the December low of $4,290.03, this trend assessment remains valid.
Gold prices briefly fell below the 50-day moving average before quickly recovering, indicating that investors view this moving average as a key support level and trend indicator. Historical data shows that this moving average consistently guided gold prices upwards until prices became excessively overbought later in 2025.
Technical Analysis
(Spot gold daily chart source: FX678)
The medium-term trading range for gold is between $3,886.51 and $5,596.33. Over the past three trading days, gold prices have found effective support at the retracement levels of $4,741.42 to $4,539.66 within this range. This range can also be defined as the core value range for gold at present, becoming an important support for the stabilization and rebound of gold prices in the short term.
The short-term fluctuation range is focused on the range of $5,596.33 (previous high) to $4,274.44 (recent low). The retracement range of $4,943.18 to $5,192.81 within this short-term range is the key upward target that needs to be watched in this round of gold rebound. Its price reaction will directly determine the sustainability of the subsequent rebound momentum.
The key focus going forward is on the price action and order flow when gold tests the $4943.18–$5192.81 range: this area will reveal whether buying pressure continues to strengthen and an upward breakout is brewing, or whether new selling/short entry will suppress the rebound and push gold prices down.
I wouldn't be surprised if sellers appear in the pullback area, because a support base hasn't formed yet.
- Risk Warning and Disclaimer
- The market involves risk, and trading may not be suitable for all investors. This article is for reference only and does not constitute personal investment advice, nor does it take into account certain users’ specific investment objectives, financial situation, or other needs. Any investment decisions made based on this information are at your own risk.