Risk aversion intensified, but the US dollar index rebounded after a sharp drop, causing gold to rise again before falling back.
2026-02-05 10:16:01
Spot gold (XAU/USD) rose sharply during Thursday's Asian trading session, climbing to around $5005 before retreating. Market sentiment refocused on geopolitical risks and safe-haven demand, while awaiting further clues from US economic data to determine the next direction of gold's price movement.
The immediate catalyst for this rebound was the sudden escalation of geopolitical tensions. The U.S. military shot down an Iranian drone that had "aggressively approached" the U.S. aircraft carrier USS Abraham Lincoln in the Arabian Sea, an incident that quickly sparked market concerns about an escalation of tensions between the U.S. and Iran.
Although Iranian and U.S. officials subsequently confirmed that they would hold talks in Oman on Friday, risk sentiment remained cautious until the outcome of the negotiations became clear, with safe-haven funds flowing back into the gold market in the short term.
Meanwhile, the market generally believes that the high volatility in the precious metals market will continue. Niklas Westermark, head of commodities trading for the Americas at Bank of America, pointed out that for some time to come, the volatility of precious metals such as gold will remain above historical averages. Even if recent extreme market conditions are not repeated, "high volatility" may become the new normal.
This assessment also explains why funds quickly replenished gold positions after the pullback. However, changes in macroeconomic policy pose a potential downward pressure on gold prices. With the Federal Reserve keeping interest rates unchanged at its January meeting and Kevin Warsh being nominated as a candidate for the next Federal Reserve Chair, the market has begun to reassess the Fed's future policy stance.
Investors generally expect the new leadership to place greater emphasis on policy independence and inflation control, an expectation that has dampened previous optimism regarding rapid interest rate cuts. Looking at interest rate pricing, the market has clearly lowered its bets on a mid-year rate cut.
According to the CME FedWatch tool, financial markets are currently pricing in only about a 46% probability of a June rate cut, a significant drop from previous highs. This adjustment in interest rate expectations has placed some valuation constraints on gold during its rebound.
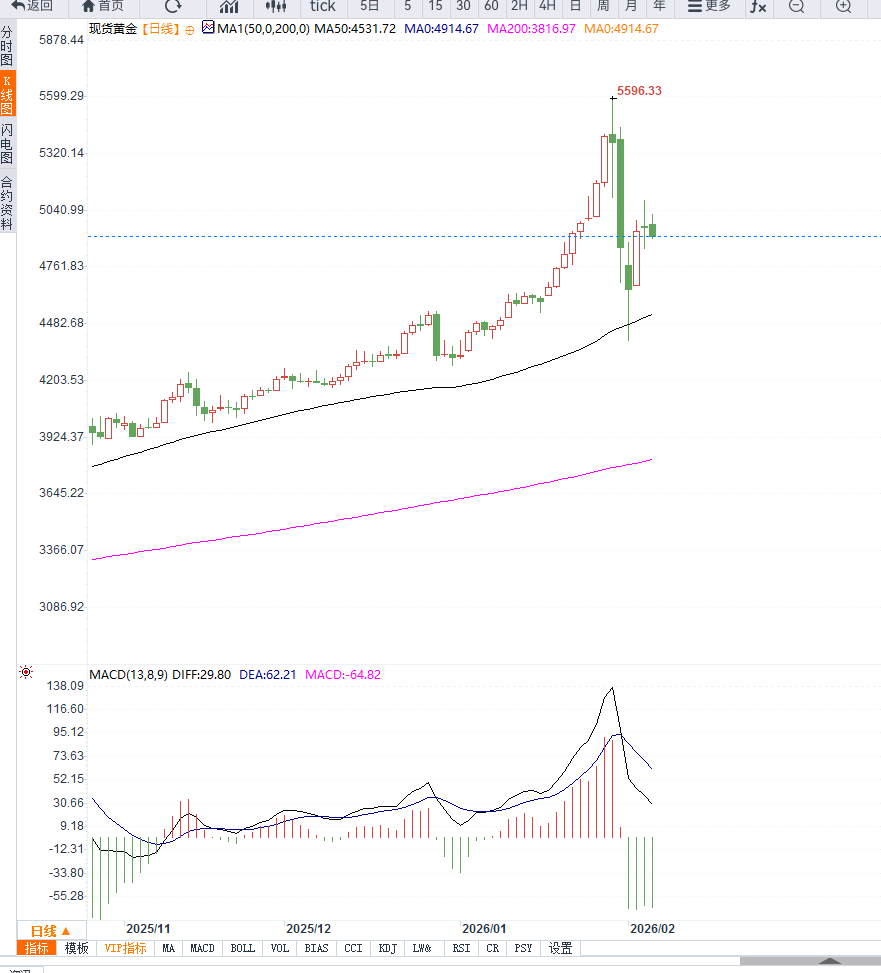
From a daily chart perspective, after experiencing rapid rises and falls, gold has entered a phase of high volatility and consolidation. The price quickly found support and rebounded after the previous sharp correction, indicating that bullish funds have not completely withdrawn due to short-term volatility, and the market structure remains relatively strong.
Regarding the moving average system, gold prices remain above the medium- and long-term moving averages, and the overall bullish alignment remains intact, indicating that the medium-term trend foundation remains solid. However, short-term moving averages are beginning to flatten, reflecting increased market divergence in the high-level area, a temporary weakening of trend-driving forces, and making prices more likely to fluctuate within a range.
Momentum indicators show that the daily RSI has clearly retreated from its high, but has not entered the weak zone, currently operating in the neutral-to-strong range. This change is more in line with the characteristics of a technical correction in a strong market than a trend reversal signal.
As long as the RSI remains above the midline, gold remains within a bullish overall framework. From a price structure perspective, the $5000 level has become a significant psychological barrier, repeatedly exerting downward pressure on prices in the short term. If gold prices can hold firmly above this area, they still have the potential to retest higher levels.
However, if it repeatedly encounters resistance and breaks below key support levels, it may enter a longer period of consolidation from a technical perspective. Overall, the daily chart for gold suggests a high-volatility consolidation within a strong uptrend, with no clear directional signal in the short term. New macroeconomic or geopolitical factors are needed to disrupt the current balance.
Editor's Note:
The core characteristic of the current gold market is not a single trend, but rather a continuous hedging between "safe-haven demand and interest rate expectations." Any geopolitical developments quickly boost safe-haven buying, but the stabilization of the US dollar and adjustments in Federal Reserve policy expectations constantly limit the upside potential of gold prices.
In this environment, gold is more likely to become a volatility asset rather than a trending asset. We await clearer policy or geopolitical signals.
The immediate catalyst for this rebound was the sudden escalation of geopolitical tensions. The U.S. military shot down an Iranian drone that had "aggressively approached" the U.S. aircraft carrier USS Abraham Lincoln in the Arabian Sea, an incident that quickly sparked market concerns about an escalation of tensions between the U.S. and Iran.
Although Iranian and U.S. officials subsequently confirmed that they would hold talks in Oman on Friday, risk sentiment remained cautious until the outcome of the negotiations became clear, with safe-haven funds flowing back into the gold market in the short term.
Meanwhile, the market generally believes that the high volatility in the precious metals market will continue. Niklas Westermark, head of commodities trading for the Americas at Bank of America, pointed out that for some time to come, the volatility of precious metals such as gold will remain above historical averages. Even if recent extreme market conditions are not repeated, "high volatility" may become the new normal.
This assessment also explains why funds quickly replenished gold positions after the pullback. However, changes in macroeconomic policy pose a potential downward pressure on gold prices. With the Federal Reserve keeping interest rates unchanged at its January meeting and Kevin Warsh being nominated as a candidate for the next Federal Reserve Chair, the market has begun to reassess the Fed's future policy stance.
Investors generally expect the new leadership to place greater emphasis on policy independence and inflation control, an expectation that has dampened previous optimism regarding rapid interest rate cuts. Looking at interest rate pricing, the market has clearly lowered its bets on a mid-year rate cut.
According to the CME FedWatch tool, financial markets are currently pricing in only about a 46% probability of a June rate cut, a significant drop from previous highs. This adjustment in interest rate expectations has placed some valuation constraints on gold during its rebound.
From a daily chart perspective, after experiencing rapid rises and falls, gold has entered a phase of high volatility and consolidation. The price quickly found support and rebounded after the previous sharp correction, indicating that bullish funds have not completely withdrawn due to short-term volatility, and the market structure remains relatively strong.
Regarding the moving average system, gold prices remain above the medium- and long-term moving averages, and the overall bullish alignment remains intact, indicating that the medium-term trend foundation remains solid. However, short-term moving averages are beginning to flatten, reflecting increased market divergence in the high-level area, a temporary weakening of trend-driving forces, and making prices more likely to fluctuate within a range.
Momentum indicators show that the daily RSI has clearly retreated from its high, but has not entered the weak zone, currently operating in the neutral-to-strong range. This change is more in line with the characteristics of a technical correction in a strong market than a trend reversal signal.
As long as the RSI remains above the midline, gold remains within a bullish overall framework. From a price structure perspective, the $5000 level has become a significant psychological barrier, repeatedly exerting downward pressure on prices in the short term. If gold prices can hold firmly above this area, they still have the potential to retest higher levels.
However, if it repeatedly encounters resistance and breaks below key support levels, it may enter a longer period of consolidation from a technical perspective. Overall, the daily chart for gold suggests a high-volatility consolidation within a strong uptrend, with no clear directional signal in the short term. New macroeconomic or geopolitical factors are needed to disrupt the current balance.
Editor's Note:
The core characteristic of the current gold market is not a single trend, but rather a continuous hedging between "safe-haven demand and interest rate expectations." Any geopolitical developments quickly boost safe-haven buying, but the stabilization of the US dollar and adjustments in Federal Reserve policy expectations constantly limit the upside potential of gold prices.
In this environment, gold is more likely to become a volatility asset rather than a trending asset. We await clearer policy or geopolitical signals.
- Risk Warning and Disclaimer
- The market involves risk, and trading may not be suitable for all investors. This article is for reference only and does not constitute personal investment advice, nor does it take into account certain users’ specific investment objectives, financial situation, or other needs. Any investment decisions made based on this information are at your own risk.