Speculative funds encountered market volatility and profit-taking selling in gold.
2026-02-05 20:04:25
On Thursday (February 5), spot gold prices fell sharply during the European session, as traders took profits after the price tested a key pullback range in the previous trading day. The gold market as a whole has entered a downward trend this week.

After speculative buying has shaken out weak hands, technical traders take control of the market.
Following the sharp sell-offs on Friday and Monday, technical traders have taken over gold trading. The long-term bullish fundamentals for gold remain unchanged, but speculative funds have been shaken out by significant volatility. Traders are currently attempting to find reasonable value levels and build a support bottom for the next upward move, a process that could potentially involve several weeks of range-bound trading.
A stronger dollar and central bank decision weighed on market sentiment.
In the short term, traders are closely watching the US dollar index rise to a two-week high, while market sentiment is generally cautious ahead of the European Central Bank (ECB) and the Bank of England (BOE) interest rate decisions. Earlier this week, the Reserve Bank of Australia (RBA) raised interest rates by 25 basis points for the first time since November 2023.
The market widely expects the European Central Bank and the Bank of England to keep interest rates unchanged, but gold investors are closely watching the two central banks' statements on inflation.
Monitoring central bank actions is one of the focuses for gold traders today, but the core focus remains on the US dollar index. The author believes that the weakening stock market coupled with the sell-off in the technology sector may have triggered a shift in market risk aversion, and increased risk aversion typically drives up demand for the US dollar.
Federal Reserve Governor Cook signals no rush to cut interest rates
Meanwhile, the debate in the US market continues regarding the timing of the Federal Reserve's first rate cut in 2026. Gold traders are focused on hawkish comments from Federal Reserve Governor Lisa Cook later on Wednesday: she stated that she is more concerned about a stalled decline in inflation than a weakening job market.
Gold traders may interpret this statement as a bearish signal, as it implies that Cook will not support further rate cuts until tariff-induced inflation begins to subside.
Classic trend chart pattern reappears
From a technical perspective, the gold market has followed a classic pattern familiar to swing traders, with no unexpected developments.
In the first round of decline, long positions were liquidated, pushing gold prices to test the pullback range of $4744.34-$4541.88 and the 50-day moving average at $4531.05. The actual low of this round of decline reached $4402.38.
From Tuesday to Wednesday, gold prices rebounded to the potential resistance range of $5,002.31-$5,143.89, before stopping at $5,091.93, after which sellers entered the market again to put downward pressure on gold prices.
Key support zone established: $4744.34-$4747.15
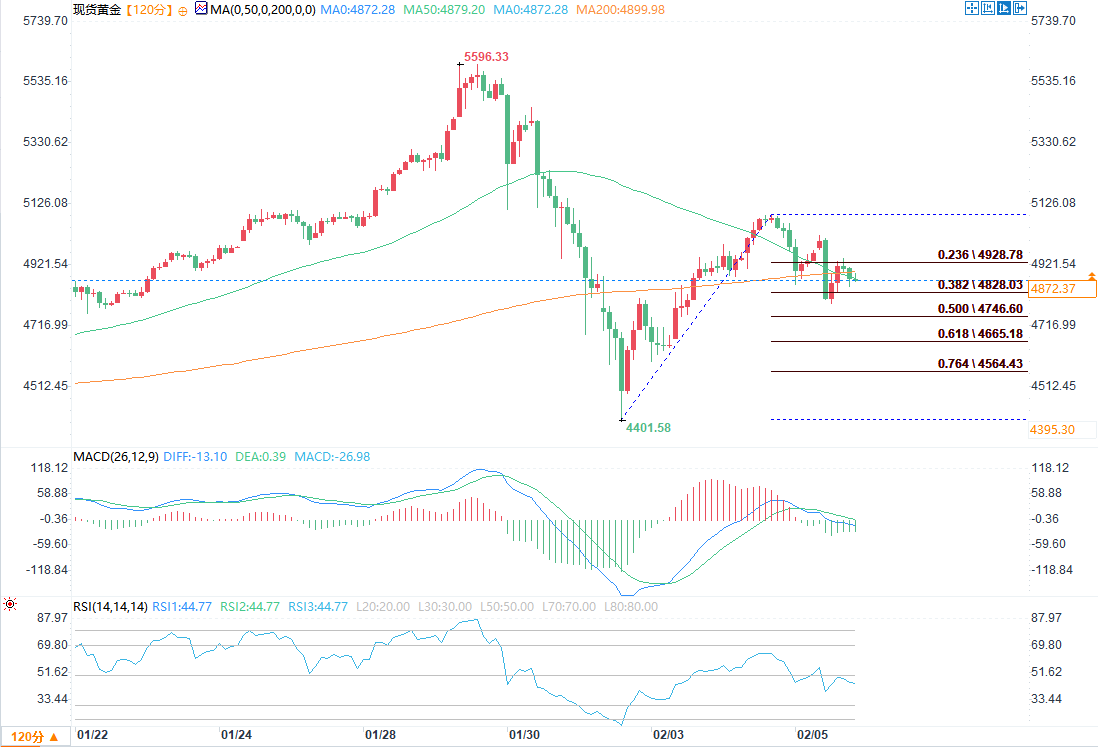
(2-hour chart of spot gold source: EasyForex)
Gold is currently trading within a new, narrow range of $4402.38 to $5091.93. The 50% Fibonacci retracement level of this range corresponds to $4747.15, which is the next downside target for gold.
This price level, along with another 50% retracement level at $4744.34, forms a dense support zone. When the gold price tests this range, buyers are likely to enter the market to take over the position.
Traders await policy clarity; gold prices may form a triangle consolidation pattern.
In the coming weeks, as traders adopt a buy-low-sell-high strategy while awaiting clarity on the Federal Reserve's policy direction, gold prices are likely to break out of a triangle consolidation pattern.
After speculative buying has shaken out weak hands, technical traders take control of the market.
Following the sharp sell-offs on Friday and Monday, technical traders have taken over gold trading. The long-term bullish fundamentals for gold remain unchanged, but speculative funds have been shaken out by significant volatility. Traders are currently attempting to find reasonable value levels and build a support bottom for the next upward move, a process that could potentially involve several weeks of range-bound trading.
A stronger dollar and central bank decision weighed on market sentiment.
In the short term, traders are closely watching the US dollar index rise to a two-week high, while market sentiment is generally cautious ahead of the European Central Bank (ECB) and the Bank of England (BOE) interest rate decisions. Earlier this week, the Reserve Bank of Australia (RBA) raised interest rates by 25 basis points for the first time since November 2023.
The market widely expects the European Central Bank and the Bank of England to keep interest rates unchanged, but gold investors are closely watching the two central banks' statements on inflation.
Monitoring central bank actions is one of the focuses for gold traders today, but the core focus remains on the US dollar index. The author believes that the weakening stock market coupled with the sell-off in the technology sector may have triggered a shift in market risk aversion, and increased risk aversion typically drives up demand for the US dollar.
Federal Reserve Governor Cook signals no rush to cut interest rates
Meanwhile, the debate in the US market continues regarding the timing of the Federal Reserve's first rate cut in 2026. Gold traders are focused on hawkish comments from Federal Reserve Governor Lisa Cook later on Wednesday: she stated that she is more concerned about a stalled decline in inflation than a weakening job market.
Gold traders may interpret this statement as a bearish signal, as it implies that Cook will not support further rate cuts until tariff-induced inflation begins to subside.
Classic trend chart pattern reappears
From a technical perspective, the gold market has followed a classic pattern familiar to swing traders, with no unexpected developments.
In the first round of decline, long positions were liquidated, pushing gold prices to test the pullback range of $4744.34-$4541.88 and the 50-day moving average at $4531.05. The actual low of this round of decline reached $4402.38.
From Tuesday to Wednesday, gold prices rebounded to the potential resistance range of $5,002.31-$5,143.89, before stopping at $5,091.93, after which sellers entered the market again to put downward pressure on gold prices.
Key support zone established: $4744.34-$4747.15
(2-hour chart of spot gold source: EasyForex)
Gold is currently trading within a new, narrow range of $4402.38 to $5091.93. The 50% Fibonacci retracement level of this range corresponds to $4747.15, which is the next downside target for gold.
This price level, along with another 50% retracement level at $4744.34, forms a dense support zone. When the gold price tests this range, buyers are likely to enter the market to take over the position.
Traders await policy clarity; gold prices may form a triangle consolidation pattern.
In the coming weeks, as traders adopt a buy-low-sell-high strategy while awaiting clarity on the Federal Reserve's policy direction, gold prices are likely to break out of a triangle consolidation pattern.
- Risk Warning and Disclaimer
- The market involves risk, and trading may not be suitable for all investors. This article is for reference only and does not constitute personal investment advice, nor does it take into account certain users’ specific investment objectives, financial situation, or other needs. Any investment decisions made based on this information are at your own risk.