Is the gold market poised for a breakout and upward surge?
2026-02-10 23:00:03
On Tuesday (February 10), during the US trading session, the spot gold market traded in a narrow range with minimal fluctuations, and prices declined slightly. The balance between bullish and bearish forces is currently balanced, and investor sentiment is cautious, suggesting that volatility may increase in the near future, and a directional decision is imminent.

Today, the key price level for judging the short-term trend of gold is the 50% Fibonacci retracement level of $5002.31. This price level is not only a technical watershed, but also the core of the battle between bulls and bears. Whether it is gained or lost directly determines the intraday trading range and short-term trend.
Gold prices rose during the day but fell back due to profit-taking pressure, but remained above the $5,000 mark, with some buying support below and no panic selling occurred.
In the short term, if gold prices continue to hold above $5,002.31 with increased trading volume, it will create conditions for breaking through the resistance level of $5,143.89, attracting bullish funds to enter the market and drive the price up. If the price breaks below this support level with increased trading volume, it will need to further correct and form a bottom, and the gold price may move closer to the $4,747.15 pivot point.
The market's failure to decisively break through the $5002.31-$5143.89 pullback range reflects a shift in investors' investment logic. They are no longer simply chasing short-term momentum, but rather prefer to wait for clear signals before entering the market at key price levels. This cautious sentiment has suppressed short-term volatility.
The long-term bullish fundamentals remain intact, and supporting factors continue to exert their influence.
Despite short-term consolidation in gold prices and cautious market sentiment, the long-term bullish fundamentals remain unchanged, with global central bank buying and geopolitical uncertainty being the two core supporting factors.
Official data shows that the People's Bank of China increased its gold holdings for the 15th consecutive month in January, and central banks in many emerging markets around the world also continued to increase their holdings. By optimizing the structure of their foreign exchange reserves to cope with economic risks, this demand at the central bank level has provided long-term support for gold prices.
Meanwhile, the global geopolitical landscape remains highly uncertain, and regional conflicts continue to escalate. Although these have not triggered widespread panic, they have consistently maintained the safe-haven demand for gold, providing effective support during price corrections and laying the foundation for a long-term bullish outlook.
Furthermore, risk appetite in global stock markets rebounded today, leading some funds to flow from the gold market into stocks, thus suppressing gold price gains. The subsequent performance of the S&P 500 index may become a catalyst for intraday gold price fluctuations; investors should pay attention to the correlation between the two.
This week's US economic data is the focus of market attention. Retail sales data today, NFP data on Wednesday, and CPI data on Friday will be released successively, gradually breaking the current stalemate in the market and pointing the way for gold prices.
Non-farm payrolls and CPI will determine the next move in gold prices and dominate expectations for Federal Reserve policy.
The key variables for the gold market this week are the NFP and CPI data, which directly determine the direction of gold prices and expectations for Federal Reserve policy, thereby affecting the timing of interest rate cuts—whether they will be brought forward to March or postponed to September, as expected in June.
The market generally expects the U.S. to add 70,000 non-farm jobs in January and for the unemployment rate to remain stable. This expectation forms the basis of current market pricing, and any deviation between the actual data and the expectation will trigger sharp fluctuations in gold prices.
If the non-farm payroll data is flat or better than expected, it indicates that the US job market is healthy, and the Federal Reserve will most likely maintain the current interest rate. The timing of the rate cut may remain in June or even be postponed to September, which will support the US dollar index and put downward pressure on gold prices.
If the data falls significantly short of expectations, indicating a weak job market and pressure on economic recovery, expectations for an earlier rate cut by the Federal Reserve will rise, potentially as early as March. A weaker dollar will then drive up gold prices.
It's important to note that the volatility triggered by Wednesday's NFP data may not be a long-term turning point; Friday's CPI data could have a more profound impact. If the CPI is higher than expected, inflationary pressures will limit the Fed's room for interest rate cuts, putting downward pressure on gold and potentially offsetting the impact of the non-farm payroll data.
The ideal data combination to drive a sustained rise in gold prices is "weak employment + stable/low inflation." This combination would reinforce expectations of an earlier interest rate cut, alleviate inflation concerns, and support rising gold prices. The magnitude of the gold price reaction, however, depends on whether the expectation of an interest rate cut shifts from June to March.
Technical Analysis: Gold prices are forming a solid bottom, building momentum for further gains.
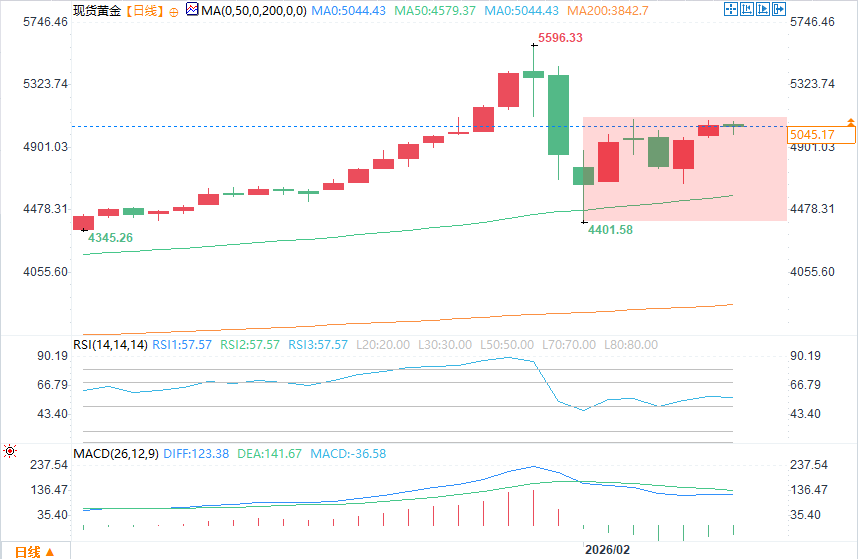
(Spot gold daily chart source: FX678)
From a technical perspective, the medium- to long-term uptrend for gold remains intact. The daily chart shows that the price is trending upwards, with the 50-day moving average around $4,580.20 and moving upwards. The gold price has consistently remained above the moving average, indicating a short-term bullish bias.
Gold prices have recently been consolidating within a wide range of $4,402.38 to $5,091.93, with a pivotal point at $4,747.15. Currently, gold prices are in the upper part of the range, fluctuating around the $5,000 mark.
This consolidation pattern helps to build a solid bottom. In technical analysis, the height of the rise is closely related to the time it takes to form a bottom and the solidity of the structure. Rises that start from a solid bottom are often more durable, while rebounds from sharp bottoms are more likely to be met with selling pressure.
The current consolidation is a process of bulls and bears battling it out and digesting selling pressure. Once the gold price breaks through the upper limit of the range at $5091.93, the bottom will be formed, and a new round of medium- to long-term rise is expected to begin. If it falls below the lower limit at $4402.38, the medium- to long-term trend may reverse, and the gold price will enter a period of adjustment.
Today, the key price level for judging the short-term trend of gold is the 50% Fibonacci retracement level of $5002.31. This price level is not only a technical watershed, but also the core of the battle between bulls and bears. Whether it is gained or lost directly determines the intraday trading range and short-term trend.
Gold prices rose during the day but fell back due to profit-taking pressure, but remained above the $5,000 mark, with some buying support below and no panic selling occurred.
In the short term, if gold prices continue to hold above $5,002.31 with increased trading volume, it will create conditions for breaking through the resistance level of $5,143.89, attracting bullish funds to enter the market and drive the price up. If the price breaks below this support level with increased trading volume, it will need to further correct and form a bottom, and the gold price may move closer to the $4,747.15 pivot point.
The market's failure to decisively break through the $5002.31-$5143.89 pullback range reflects a shift in investors' investment logic. They are no longer simply chasing short-term momentum, but rather prefer to wait for clear signals before entering the market at key price levels. This cautious sentiment has suppressed short-term volatility.
The long-term bullish fundamentals remain intact, and supporting factors continue to exert their influence.
Despite short-term consolidation in gold prices and cautious market sentiment, the long-term bullish fundamentals remain unchanged, with global central bank buying and geopolitical uncertainty being the two core supporting factors.
Official data shows that the People's Bank of China increased its gold holdings for the 15th consecutive month in January, and central banks in many emerging markets around the world also continued to increase their holdings. By optimizing the structure of their foreign exchange reserves to cope with economic risks, this demand at the central bank level has provided long-term support for gold prices.
Meanwhile, the global geopolitical landscape remains highly uncertain, and regional conflicts continue to escalate. Although these have not triggered widespread panic, they have consistently maintained the safe-haven demand for gold, providing effective support during price corrections and laying the foundation for a long-term bullish outlook.
Furthermore, risk appetite in global stock markets rebounded today, leading some funds to flow from the gold market into stocks, thus suppressing gold price gains. The subsequent performance of the S&P 500 index may become a catalyst for intraday gold price fluctuations; investors should pay attention to the correlation between the two.
This week's US economic data is the focus of market attention. Retail sales data today, NFP data on Wednesday, and CPI data on Friday will be released successively, gradually breaking the current stalemate in the market and pointing the way for gold prices.
Non-farm payrolls and CPI will determine the next move in gold prices and dominate expectations for Federal Reserve policy.
The key variables for the gold market this week are the NFP and CPI data, which directly determine the direction of gold prices and expectations for Federal Reserve policy, thereby affecting the timing of interest rate cuts—whether they will be brought forward to March or postponed to September, as expected in June.
The market generally expects the U.S. to add 70,000 non-farm jobs in January and for the unemployment rate to remain stable. This expectation forms the basis of current market pricing, and any deviation between the actual data and the expectation will trigger sharp fluctuations in gold prices.
If the non-farm payroll data is flat or better than expected, it indicates that the US job market is healthy, and the Federal Reserve will most likely maintain the current interest rate. The timing of the rate cut may remain in June or even be postponed to September, which will support the US dollar index and put downward pressure on gold prices.
If the data falls significantly short of expectations, indicating a weak job market and pressure on economic recovery, expectations for an earlier rate cut by the Federal Reserve will rise, potentially as early as March. A weaker dollar will then drive up gold prices.
It's important to note that the volatility triggered by Wednesday's NFP data may not be a long-term turning point; Friday's CPI data could have a more profound impact. If the CPI is higher than expected, inflationary pressures will limit the Fed's room for interest rate cuts, putting downward pressure on gold and potentially offsetting the impact of the non-farm payroll data.
The ideal data combination to drive a sustained rise in gold prices is "weak employment + stable/low inflation." This combination would reinforce expectations of an earlier interest rate cut, alleviate inflation concerns, and support rising gold prices. The magnitude of the gold price reaction, however, depends on whether the expectation of an interest rate cut shifts from June to March.
Technical Analysis: Gold prices are forming a solid bottom, building momentum for further gains.
(Spot gold daily chart source: FX678)
From a technical perspective, the medium- to long-term uptrend for gold remains intact. The daily chart shows that the price is trending upwards, with the 50-day moving average around $4,580.20 and moving upwards. The gold price has consistently remained above the moving average, indicating a short-term bullish bias.
Gold prices have recently been consolidating within a wide range of $4,402.38 to $5,091.93, with a pivotal point at $4,747.15. Currently, gold prices are in the upper part of the range, fluctuating around the $5,000 mark.
This consolidation pattern helps to build a solid bottom. In technical analysis, the height of the rise is closely related to the time it takes to form a bottom and the solidity of the structure. Rises that start from a solid bottom are often more durable, while rebounds from sharp bottoms are more likely to be met with selling pressure.
The current consolidation is a process of bulls and bears battling it out and digesting selling pressure. Once the gold price breaks through the upper limit of the range at $5091.93, the bottom will be formed, and a new round of medium- to long-term rise is expected to begin. If it falls below the lower limit at $4402.38, the medium- to long-term trend may reverse, and the gold price will enter a period of adjustment.
- Risk Warning and Disclaimer
- The market involves risk, and trading may not be suitable for all investors. This article is for reference only and does not constitute personal investment advice, nor does it take into account certain users’ specific investment objectives, financial situation, or other needs. Any investment decisions made based on this information are at your own risk.