High oil prices supported the Canadian dollar, while the US dollar was boosted by the FOMC minutes and US economic data, causing the USD/CAD pair to remain volatile.
2026-02-20 12:29:51
The USD/CAD pair remained range-bound in Asian trading on Friday, hovering around 1.3690. The Canadian dollar was supported by commodity prices, offsetting some of the upward pressure on the US dollar.
Canada is the largest oil supplier to the United States, accounting for about 60% of the total crude oil imports of the United States. Therefore, oil prices have a direct impact on the Canadian dollar.
WTI crude oil prices hovered around $66.50 per barrel, near a six-month high of $66.82, as escalating tensions between the US and Iran exacerbated supply concerns.
US President Trump warned that “bad things” would happen if no deal was reached with Iran, highlighting potential military risks. Iran responded that it does not seek conflict but will respond to any military provocation.
Regarding the US dollar, the January FOMC minutes released a hawkish signal. Although most officials supported keeping interest rates unchanged, some officials hinted that a rate hike was still possible if inflation remained high, and that policy easing might be possible if inflation fell.
US initial jobless claims data showed 206,000, lower than the market expectation of 225,000, which also provided support for the US dollar. Market attention will turn to Friday's US Q4 GDP preliminary reading and PCE data.
This will provide new guidance for the short-term trend of the US dollar and may trigger range-bound trading in USD/CAD.
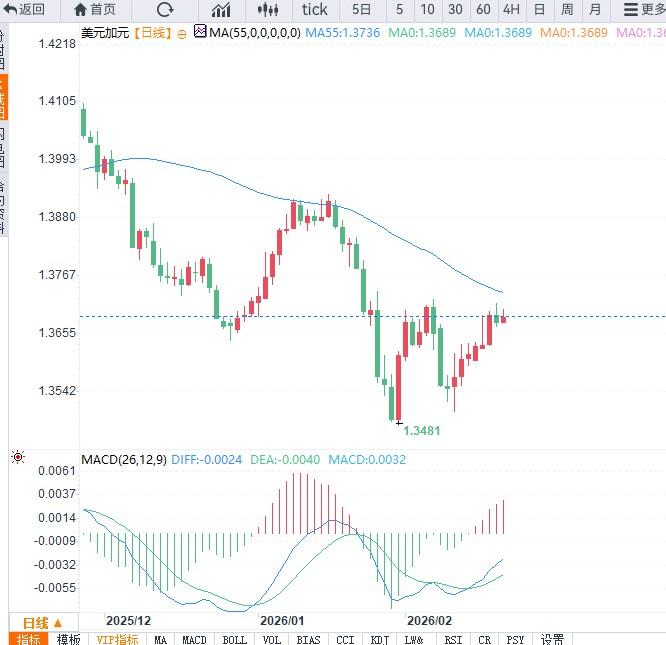
The daily chart shows that USD/CAD is oscillating between 1.3660 and 1.3720, with the 50-day EMA forming resistance around 1.3740 and the 200-day EMA providing support around 1.3600.
The daily candlestick chart shows a small positive candle, indicating a temporary balance between bulls and bears, but upward pressure remains. The 4-hour chart shows USD/CAD consolidating in a narrow range around 1.3700, with the MACD line above the zero line and the momentum bars contracting, indicating a temporary balance between short-term buying and selling forces.
The RSI is hovering around 55, suggesting there is no overbought or oversold pressure yet. If the price breaks through 1.3740, it may test the 1.3780 resistance level in the short term; if it falls back and breaks below the 1.3660 support, it may test the key support level of 1.3600.
Editor's Note:
The USD/CAD pair is currently trading in a range, influenced by a combination of a strong US dollar and support from high oil prices. If US GDP and PCE data exceed expectations, the US dollar may strengthen further, putting pressure on the Canadian dollar in the short term, and the USD/CAD pair could test its upward resistance level.
If the data is weak, it could trigger a technical pullback.
Canada is the largest oil supplier to the United States, accounting for about 60% of the total crude oil imports of the United States. Therefore, oil prices have a direct impact on the Canadian dollar.
WTI crude oil prices hovered around $66.50 per barrel, near a six-month high of $66.82, as escalating tensions between the US and Iran exacerbated supply concerns.
US President Trump warned that “bad things” would happen if no deal was reached with Iran, highlighting potential military risks. Iran responded that it does not seek conflict but will respond to any military provocation.
Regarding the US dollar, the January FOMC minutes released a hawkish signal. Although most officials supported keeping interest rates unchanged, some officials hinted that a rate hike was still possible if inflation remained high, and that policy easing might be possible if inflation fell.
US initial jobless claims data showed 206,000, lower than the market expectation of 225,000, which also provided support for the US dollar. Market attention will turn to Friday's US Q4 GDP preliminary reading and PCE data.
This will provide new guidance for the short-term trend of the US dollar and may trigger range-bound trading in USD/CAD.
The daily chart shows that USD/CAD is oscillating between 1.3660 and 1.3720, with the 50-day EMA forming resistance around 1.3740 and the 200-day EMA providing support around 1.3600.
The daily candlestick chart shows a small positive candle, indicating a temporary balance between bulls and bears, but upward pressure remains. The 4-hour chart shows USD/CAD consolidating in a narrow range around 1.3700, with the MACD line above the zero line and the momentum bars contracting, indicating a temporary balance between short-term buying and selling forces.
The RSI is hovering around 55, suggesting there is no overbought or oversold pressure yet. If the price breaks through 1.3740, it may test the 1.3780 resistance level in the short term; if it falls back and breaks below the 1.3660 support, it may test the key support level of 1.3600.
Editor's Note:
The USD/CAD pair is currently trading in a range, influenced by a combination of a strong US dollar and support from high oil prices. If US GDP and PCE data exceed expectations, the US dollar may strengthen further, putting pressure on the Canadian dollar in the short term, and the USD/CAD pair could test its upward resistance level.
If the data is weak, it could trigger a technical pullback.
- Risk Warning and Disclaimer
- The market involves risk, and trading may not be suitable for all investors. This article is for reference only and does not constitute personal investment advice, nor does it take into account certain users’ specific investment objectives, financial situation, or other needs. Any investment decisions made based on this information are at your own risk.