The Fed's hawkish move sends gold prices tumbling over 1%. Can geopolitical tensions save the bulls?
2026-02-24 13:28:05
On Tuesday (February 24) during Asian trading hours, spot gold fell sharply from around $5,250, seemingly ending its previous four-day winning streak. It is currently trading around $5,170 per ounce, down approximately 1.1% on the day. Following the knee-jerk drop and subsequent rebound of the dollar triggered by US President Trump's new global tariff policies, the dollar has once again attracted buyers due to the hawkish outlook from the Federal Reserve, which is considered a key factor putting downward pressure on gold prices.
In fact, the minutes of the Fed's January meeting released last week showed that many officials believed there might be no need for further monetary easing until it was clear that the decline in inflation was back on track. Furthermore, Fed Governor Waller stated on Monday that if the upcoming February jobs data shows the U.S. labor market has "turned to a more solid state" after a weak 2025, he would likely support keeping interest rates unchanged at the March meeting.
However, the CME FedWatch Tool shows that traders still expect the Federal Reserve to cut interest rates by three 25 basis points in 2026, which should be beneficial for gold, a non-interest-bearing asset. Furthermore, concerns about the potential economic impact of Trump's trade policies may limit any meaningful appreciation of the dollar and help limit the downside for gold prices. This warrants caution from bearish traders, who should be wary of a potentially deeper decline.
In addition, concerns about potential military conflict in the Middle East ahead of the third round of US-Iran nuclear negotiations may help limit the downside for safe-haven gold. This, in turn, makes it prudent to wait for strong selling pressure before confirming that the week-long upward trend in gold prices has lost momentum.
Traders are now focused on U.S. macroeconomic data, which, along with speeches from influential Federal Open Market Committee members, could provide some impetus later on Tuesday.
The 4-hour chart shows that, against the backdrop of a recent rebound from the 200-period moving average (MA, 4896.98), the previous trading day's break above the $5140 resistance level is seen as a new trigger for gold bulls. This level coincides with the 61.8% Fibonacci retracement of the historical peak's sharp correction (5137.06) and should be considered a key pivot point.
Although the MACD oscillator histogram remains in positive territory, it is showing a gradually narrowing trend, suggesting a slowdown in the upward momentum. The Relative Strength Index (RSI) is above the midline and has moved out of the overbought zone, showing a downward trend, which is consistent with the slowdown in the upward trend.
On the upside, the 76.4% Fibonacci retracement level at $5311.26 may become a key resistance level to break through. If gold can close above this level, further upward movement is possible.
On the downside, if it fails to hold above the 61.8% Fibonacci retracement level, it indicates weakening upward momentum and a risk of a deeper pullback to the 200-period moving average.
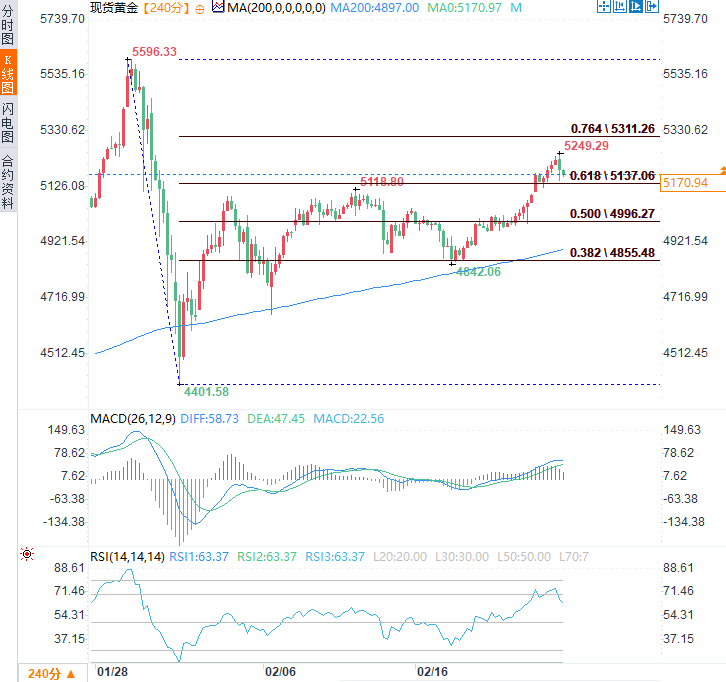
(Spot gold 4-hour chart, source: FX678)
At 13:27 Beijing time, spot gold was trading at $5170.27 per ounce.
In fact, the minutes of the Fed's January meeting released last week showed that many officials believed there might be no need for further monetary easing until it was clear that the decline in inflation was back on track. Furthermore, Fed Governor Waller stated on Monday that if the upcoming February jobs data shows the U.S. labor market has "turned to a more solid state" after a weak 2025, he would likely support keeping interest rates unchanged at the March meeting.
However, the CME FedWatch Tool shows that traders still expect the Federal Reserve to cut interest rates by three 25 basis points in 2026, which should be beneficial for gold, a non-interest-bearing asset. Furthermore, concerns about the potential economic impact of Trump's trade policies may limit any meaningful appreciation of the dollar and help limit the downside for gold prices. This warrants caution from bearish traders, who should be wary of a potentially deeper decline.
In addition, concerns about potential military conflict in the Middle East ahead of the third round of US-Iran nuclear negotiations may help limit the downside for safe-haven gold. This, in turn, makes it prudent to wait for strong selling pressure before confirming that the week-long upward trend in gold prices has lost momentum.
Traders are now focused on U.S. macroeconomic data, which, along with speeches from influential Federal Open Market Committee members, could provide some impetus later on Tuesday.
Technical Analysis
The 4-hour chart shows that, against the backdrop of a recent rebound from the 200-period moving average (MA, 4896.98), the previous trading day's break above the $5140 resistance level is seen as a new trigger for gold bulls. This level coincides with the 61.8% Fibonacci retracement of the historical peak's sharp correction (5137.06) and should be considered a key pivot point.
Although the MACD oscillator histogram remains in positive territory, it is showing a gradually narrowing trend, suggesting a slowdown in the upward momentum. The Relative Strength Index (RSI) is above the midline and has moved out of the overbought zone, showing a downward trend, which is consistent with the slowdown in the upward trend.
On the upside, the 76.4% Fibonacci retracement level at $5311.26 may become a key resistance level to break through. If gold can close above this level, further upward movement is possible.
On the downside, if it fails to hold above the 61.8% Fibonacci retracement level, it indicates weakening upward momentum and a risk of a deeper pullback to the 200-period moving average.
(Spot gold 4-hour chart, source: FX678)
At 13:27 Beijing time, spot gold was trading at $5170.27 per ounce.
- Risk Warning and Disclaimer
- The market involves risk, and trading may not be suitable for all investors. This article is for reference only and does not constitute personal investment advice, nor does it take into account certain users’ specific investment objectives, financial situation, or other needs. Any investment decisions made based on this information are at your own risk.