The Canadian dollar rises on oil, while the US dollar weakens due to tax cuts: Where will this tug-of-war end?
2026-02-26 17:52:39
On Thursday, February 26th, during the European session, the USD/CAD pair fluctuated narrowly around 1.3670, seemingly held down by an invisible hand, unable to break out of the recent consolidation range. The core of this forex game lies in the ebb and flow of sentiment at both ends. Signals released by the US Trade Representative on Wednesday sent shivers down the spines of the market: tariffs on several countries could be raised to 15% or even higher in the coming days, and this authorization is only valid for a 150-day window. This policy uncertainty hangs like a Damocles' sword, causing traders to be cautious about the dollar in the short term, reducing their long positions to hedge against the risks of surging external costs and fluctuations in corporate profits.
On the other hand, the Canadian dollar, as a resource-based currency, has found a safe haven. Recent geopolitical risks have repeatedly pushed up oil prices, and Canada, as a major oil exporter, directly benefits from the support of commodity channels. Stronger oil prices have improved Canada's terms of trade, injecting resilience into the Canadian dollar and repeatedly hindering the upward momentum of the USD/CAD exchange rate. Analysts believe that this hedging pattern—the US dollar constrained by policy uncertainty, while the Canadian dollar benefits from energy gains—is the main logic behind the current relatively weak exchange rate consolidation.
Beneath the calm surface of the market, undercurrents are stirring, as Friday brings the release of crucial data that will determine the short-term direction. Market attention is focused on two key indicators: Canada's GDP and the US Producer Price Index (PPI). For the US data, the market expects the January PPI to rise 0.3% month-on-month, down from 0.5% previously; the year-on-year increase is projected at 2.6%, compared to 3.0% previously. This data will serve as a litmus test for upstream price pressures. If the actual figure is higher than expected, it indicates that inflation is more persistent than anticipated, potentially weakening market bets on further interest rate cuts. This would provide strong support for the US dollar from an interest rate expectation perspective, pushing the exchange rate upwards to test the resistance level of the current range.
Conversely, if the data is moderate, expectations for an interest rate cut will rise again, potentially putting downward pressure on the US dollar and causing the exchange rate to fall back to test lower support levels. Meanwhile, Canada's economic performance should not be underestimated. If its GDP is robust, it will further strengthen the Canadian dollar's fundamental resilience, making further upward movement more difficult; conversely, weak performance could weaken the Canadian dollar's defenses, opening up upside potential should the US dollar rebound. Before the data release, any slight disturbance can be amplified, and trading will depend on the final outcome of these figures.
From a chart pattern and technical indicators perspective, the USD/CAD pair is currently trapped within a range of 1.3630 to 1.3716, with the current price positioned awkwardly slightly below the middle, lacking a decisive advantage for either bulls or bears. The 1.3716 area forms a strong resistance line; only a decisive break and hold above this level could allow the market to re-evaluate the dollar's strength and potentially target higher highs. On the downside, 1.3630 is a crucial support level; a breach of this level would indicate overwhelming demand for the Canadian dollar, potentially leading to a lower equilibrium level for the exchange rate.
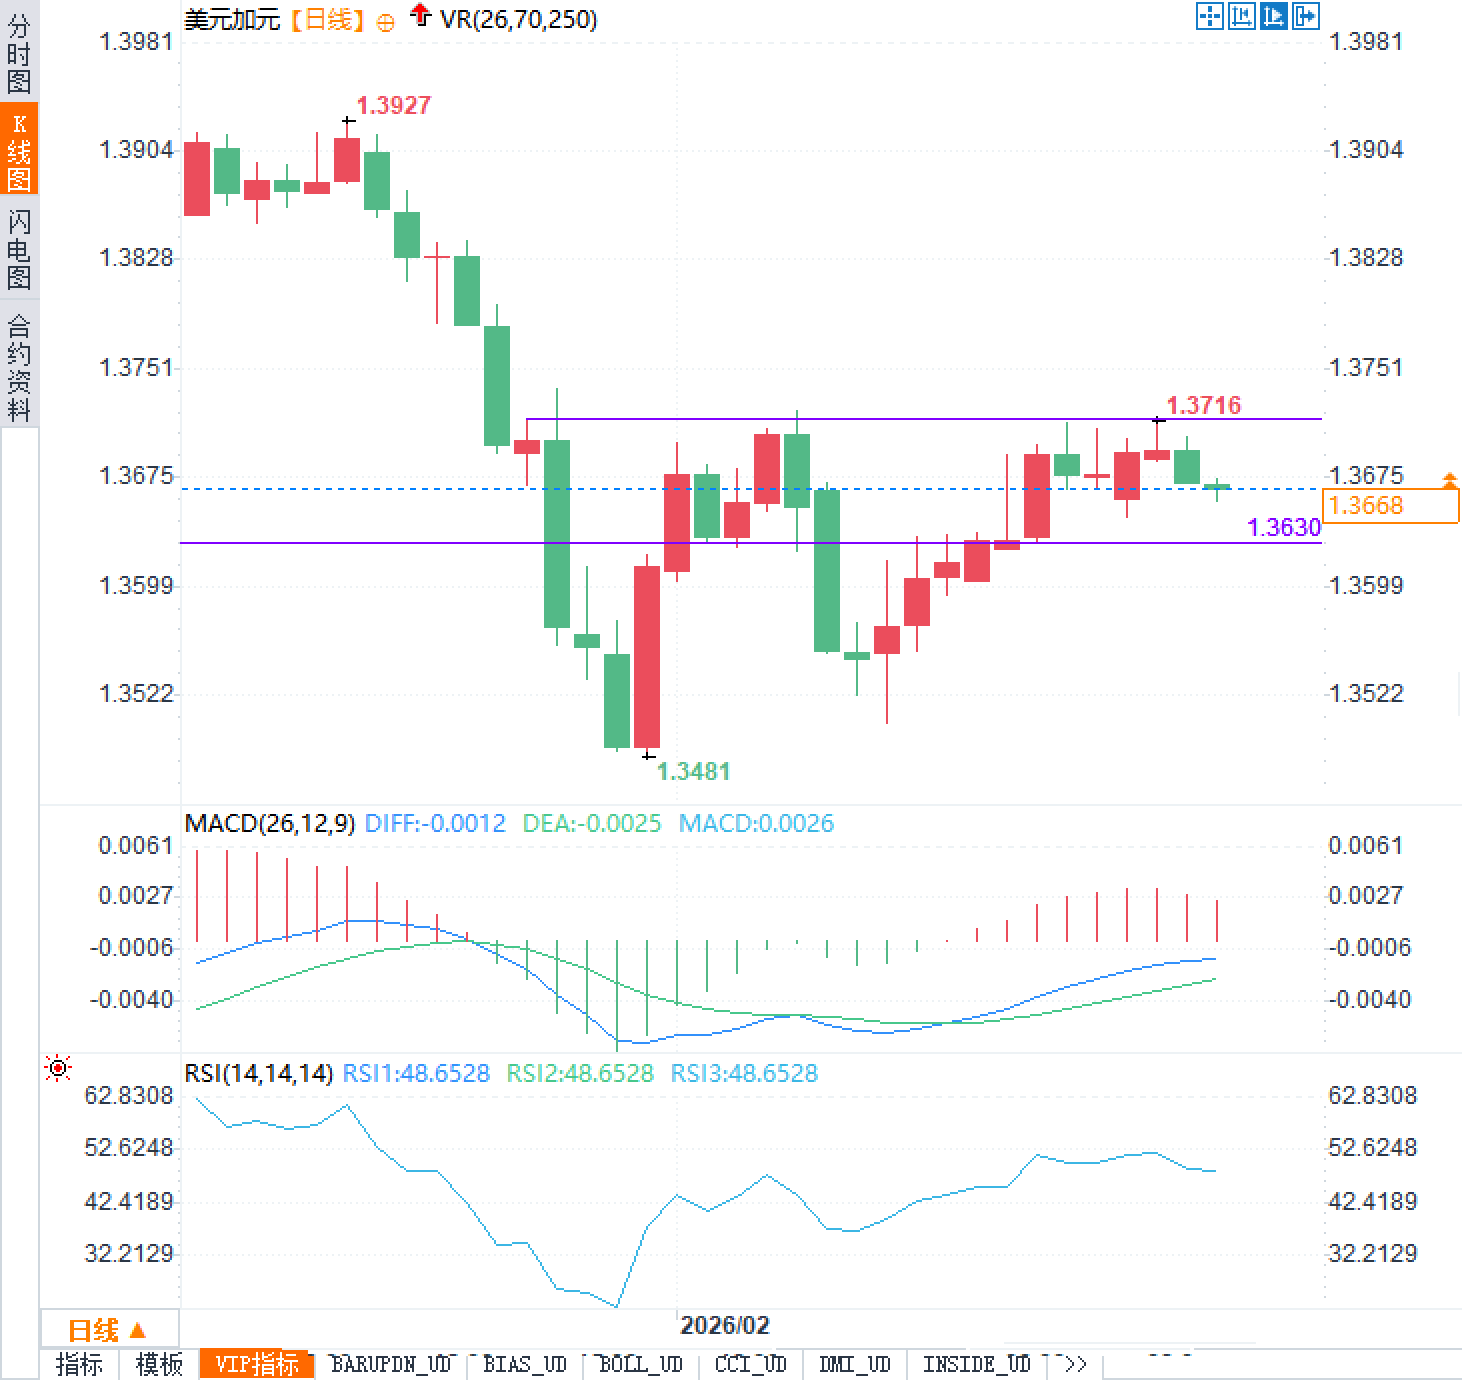
Technical indicators also confirm this stalemate: the Relative Strength Index (RSI) hovers around 48, below 50 but not in extreme territory, indicating the market is patiently waiting for a catalyst rather than rushing into a one-sided acceleration; the Moving Average Convergence Divergence (MAD) histogram shows slight improvement but limited strength, suggesting that short-term rebounds and pullbacks will be characterized by repeated back-and-forth movements. Traders are observing the validity of breakouts and confirmation pullbacks around key price levels, combining Friday's data results to determine whether this narrow range will be broken completely. After all, under the dual pressure of geopolitics (such as progress in US-Iran nuclear negotiations) and macroeconomic data, temporary calm often sets the stage for more dramatic volatility.
On the other hand, the Canadian dollar, as a resource-based currency, has found a safe haven. Recent geopolitical risks have repeatedly pushed up oil prices, and Canada, as a major oil exporter, directly benefits from the support of commodity channels. Stronger oil prices have improved Canada's terms of trade, injecting resilience into the Canadian dollar and repeatedly hindering the upward momentum of the USD/CAD exchange rate. Analysts believe that this hedging pattern—the US dollar constrained by policy uncertainty, while the Canadian dollar benefits from energy gains—is the main logic behind the current relatively weak exchange rate consolidation.
On the eve of the data showdown: The dual test of inflation and growth
Beneath the calm surface of the market, undercurrents are stirring, as Friday brings the release of crucial data that will determine the short-term direction. Market attention is focused on two key indicators: Canada's GDP and the US Producer Price Index (PPI). For the US data, the market expects the January PPI to rise 0.3% month-on-month, down from 0.5% previously; the year-on-year increase is projected at 2.6%, compared to 3.0% previously. This data will serve as a litmus test for upstream price pressures. If the actual figure is higher than expected, it indicates that inflation is more persistent than anticipated, potentially weakening market bets on further interest rate cuts. This would provide strong support for the US dollar from an interest rate expectation perspective, pushing the exchange rate upwards to test the resistance level of the current range.
Conversely, if the data is moderate, expectations for an interest rate cut will rise again, potentially putting downward pressure on the US dollar and causing the exchange rate to fall back to test lower support levels. Meanwhile, Canada's economic performance should not be underestimated. If its GDP is robust, it will further strengthen the Canadian dollar's fundamental resilience, making further upward movement more difficult; conversely, weak performance could weaken the Canadian dollar's defenses, opening up upside potential should the US dollar rebound. Before the data release, any slight disturbance can be amplified, and trading will depend on the final outcome of these figures.
The Box-like Dilemma and the Opportunity for Breakthrough: A Neutral Technical Perspective
From a chart pattern and technical indicators perspective, the USD/CAD pair is currently trapped within a range of 1.3630 to 1.3716, with the current price positioned awkwardly slightly below the middle, lacking a decisive advantage for either bulls or bears. The 1.3716 area forms a strong resistance line; only a decisive break and hold above this level could allow the market to re-evaluate the dollar's strength and potentially target higher highs. On the downside, 1.3630 is a crucial support level; a breach of this level would indicate overwhelming demand for the Canadian dollar, potentially leading to a lower equilibrium level for the exchange rate.
Technical indicators also confirm this stalemate: the Relative Strength Index (RSI) hovers around 48, below 50 but not in extreme territory, indicating the market is patiently waiting for a catalyst rather than rushing into a one-sided acceleration; the Moving Average Convergence Divergence (MAD) histogram shows slight improvement but limited strength, suggesting that short-term rebounds and pullbacks will be characterized by repeated back-and-forth movements. Traders are observing the validity of breakouts and confirmation pullbacks around key price levels, combining Friday's data results to determine whether this narrow range will be broken completely. After all, under the dual pressure of geopolitics (such as progress in US-Iran nuclear negotiations) and macroeconomic data, temporary calm often sets the stage for more dramatic volatility.
- Risk Warning and Disclaimer
- The market involves risk, and trading may not be suitable for all investors. This article is for reference only and does not constitute personal investment advice, nor does it take into account certain users’ specific investment objectives, financial situation, or other needs. Any investment decisions made based on this information are at your own risk.