USD/JPY Analysis: Kazuo Ueda's comments on interest rate hikes support the yen's rebound.
2026-02-26 18:19:48
On Thursday (February 26), during the European session, the USD/JPY pair continued its recent oscillating trend, fluctuating narrowly between 155.69 and 156.38, with an overall weak bias. The core driving forces remain the uncertainty surrounding Japan's monetary policy outlook and the multiple pressures facing the US dollar itself.
Japanese Yen: The Struggle Between Interest Rate Hike Expectations and Political Interference
The recent movement of the yen has been primarily driven by disagreements stemming from the issue of the Bank of Japan's independence. On one hand, Bank of Japan Governor Kazuo Ueda has clearly stated that the government will carefully review data at the March and April meetings to leave room for interest rate hikes; on the other hand, hawkish board member Hajime Takada has also called for attention to the risk of excessive inflation. These signals technically support a yen rebound.
On the other hand, Prime Minister Sanae Takaichi spearheaded the new round of Bank of Central Bank (BOC) board appointments—both Toshiro Asada and Ayano Sato belong to the reflation faction, and both are highly aligned with dovish positions. More noteworthy is the exclusion of the Ministry of Finance from the nomination process, and Takaichi reportedly expressed reservations about interest rate hikes in a private meeting with Ueda. These actions send a clear political signal to the market: the BOC will face continued political pressure in the policy normalization process over the next few years.
The market's current conclusion is relatively clear-headed—interest rate hikes are still possible, but political resistance is accumulating, and the long-term policy path has become increasingly unclear. If Sanae Takashi's term extends to 2028, she will have the opportunity to lead the entire central bank leadership transition, including Kazuo Ueda, and this potential risk cannot be ignored.
US Dollar: Tariff Uncertainty Suppresses Rebound
Regarding the US dollar, both support and pressure coexist. Following the US Supreme Court's ruling that Trump's reciprocal tariffs were unconstitutional, the market did not react with panic, with investors generally believing that Washington would eventually find a workaround. Trump subsequently announced a 10% global tariff on countries with trade agreements with the US, and Trade Representative Greer hinted that tariffs on some countries might rise further to over 15%, but a specific list has yet to be released.
This ambiguous stance has kept the market in a wait-and-see mode. The State of the Union address offered virtually no new policy signals, and traders are currently more inclined to observe subsequent data and policy details rather than actively going long on the dollar.
At the Federal Reserve level, maintaining interest rates unchanged in March and April has become the market's benchmark expectation, a view corroborated by statements from St. Louis Fed President Musalaim. In the short term, the Fed is unlikely to provide additional upward momentum for the dollar.
Market sentiment: No surprises, waiting for data.
Nvidia's better-than-expected earnings boosted risk appetite, with US tech stocks briefly hitting two-week highs. However, gains narrowed in after-hours trading, and US stock futures also declined slightly, indicating limited market resilience to optimism. With no unexpected events emerging in the geopolitical or stock market spheres, the overall market atmosphere remains cautious and wait-and-see.
The 10-year US Treasury yield remained around 4.05%, and did not provide significant directional guidance for the foreign exchange market.
Technical Analysis
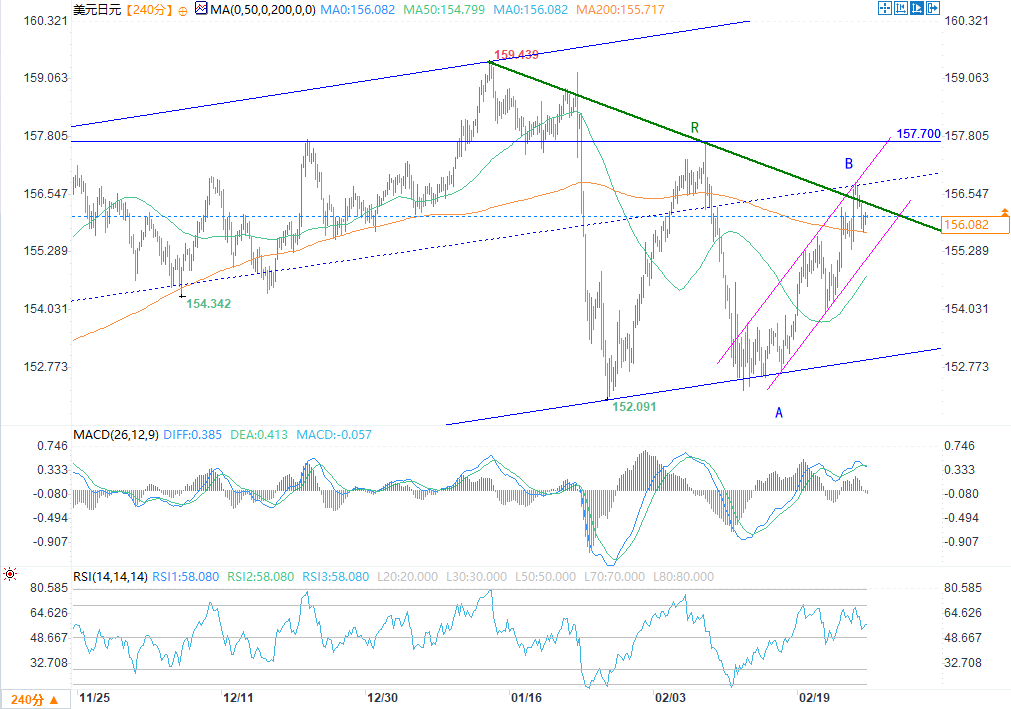
(USD/JPY 4-hour chart source: EasyForex)
As can be seen from the USD/JPY chart, this currency pair exhibited strong upward momentum in late February. Market expectations of a weaker yen pushed the yen to depreciate again (range A→B), forming the upward trend marked in purple on the chart.
However, the pair retreated on Wednesday, which should be seen as a temporary pullback since point B. Technical analysis of USD/JPY indicates that it is becoming increasingly difficult for the price to continue its upward movement along the purple trendline.
Factors favorable to short sellers include:
The midline of the upward channel (constructed by the blue dotted line in the chart). The midline is usually an area where the forces of buyers and sellers are in equilibrium, where supply and demand converge, and where trend momentum tends to weaken.
The key resistance level of 157.70 is just around the corner. This price level acted as resistance in 2025; although the price briefly broke through it in January 2026 (where it once showed signs of support), it became an obstacle to the bulls again on February 9 after a sharp drop on January 23.
The trend line R is formed by connecting the successively decreasing highs in 2026.
Japanese Yen: The Struggle Between Interest Rate Hike Expectations and Political Interference
The recent movement of the yen has been primarily driven by disagreements stemming from the issue of the Bank of Japan's independence. On one hand, Bank of Japan Governor Kazuo Ueda has clearly stated that the government will carefully review data at the March and April meetings to leave room for interest rate hikes; on the other hand, hawkish board member Hajime Takada has also called for attention to the risk of excessive inflation. These signals technically support a yen rebound.
On the other hand, Prime Minister Sanae Takaichi spearheaded the new round of Bank of Central Bank (BOC) board appointments—both Toshiro Asada and Ayano Sato belong to the reflation faction, and both are highly aligned with dovish positions. More noteworthy is the exclusion of the Ministry of Finance from the nomination process, and Takaichi reportedly expressed reservations about interest rate hikes in a private meeting with Ueda. These actions send a clear political signal to the market: the BOC will face continued political pressure in the policy normalization process over the next few years.
The market's current conclusion is relatively clear-headed—interest rate hikes are still possible, but political resistance is accumulating, and the long-term policy path has become increasingly unclear. If Sanae Takashi's term extends to 2028, she will have the opportunity to lead the entire central bank leadership transition, including Kazuo Ueda, and this potential risk cannot be ignored.
US Dollar: Tariff Uncertainty Suppresses Rebound
Regarding the US dollar, both support and pressure coexist. Following the US Supreme Court's ruling that Trump's reciprocal tariffs were unconstitutional, the market did not react with panic, with investors generally believing that Washington would eventually find a workaround. Trump subsequently announced a 10% global tariff on countries with trade agreements with the US, and Trade Representative Greer hinted that tariffs on some countries might rise further to over 15%, but a specific list has yet to be released.
This ambiguous stance has kept the market in a wait-and-see mode. The State of the Union address offered virtually no new policy signals, and traders are currently more inclined to observe subsequent data and policy details rather than actively going long on the dollar.
At the Federal Reserve level, maintaining interest rates unchanged in March and April has become the market's benchmark expectation, a view corroborated by statements from St. Louis Fed President Musalaim. In the short term, the Fed is unlikely to provide additional upward momentum for the dollar.
Market sentiment: No surprises, waiting for data.
Nvidia's better-than-expected earnings boosted risk appetite, with US tech stocks briefly hitting two-week highs. However, gains narrowed in after-hours trading, and US stock futures also declined slightly, indicating limited market resilience to optimism. With no unexpected events emerging in the geopolitical or stock market spheres, the overall market atmosphere remains cautious and wait-and-see.
The 10-year US Treasury yield remained around 4.05%, and did not provide significant directional guidance for the foreign exchange market.
Technical Analysis
(USD/JPY 4-hour chart source: EasyForex)
As can be seen from the USD/JPY chart, this currency pair exhibited strong upward momentum in late February. Market expectations of a weaker yen pushed the yen to depreciate again (range A→B), forming the upward trend marked in purple on the chart.
However, the pair retreated on Wednesday, which should be seen as a temporary pullback since point B. Technical analysis of USD/JPY indicates that it is becoming increasingly difficult for the price to continue its upward movement along the purple trendline.
Factors favorable to short sellers include:
The midline of the upward channel (constructed by the blue dotted line in the chart). The midline is usually an area where the forces of buyers and sellers are in equilibrium, where supply and demand converge, and where trend momentum tends to weaken.
The key resistance level of 157.70 is just around the corner. This price level acted as resistance in 2025; although the price briefly broke through it in January 2026 (where it once showed signs of support), it became an obstacle to the bulls again on February 9 after a sharp drop on January 23.
The trend line R is formed by connecting the successively decreasing highs in 2026.
- Risk Warning and Disclaimer
- The market involves risk, and trading may not be suitable for all investors. This article is for reference only and does not constitute personal investment advice, nor does it take into account certain users’ specific investment objectives, financial situation, or other needs. Any investment decisions made based on this information are at your own risk.