Are US Treasury bonds unwanted? Can the dollar hold up? How high can gold go in this safe-haven surge?
2026-02-26 19:54:52
On Thursday (February 26), global financial markets maintained their recent cautious tone. Although the US dollar index rebounded slightly in the previous trading day, it failed to reverse the downward pressure seen this week; spot gold held steady within a trading range below historical highs, indicating a delicate balance between bullish and bearish forces. Meanwhile, the US Treasury yield curve shifted downwards overall, with the 10-year Treasury yield approaching the key technical level of 4.04%, becoming a core variable driving current market pricing. This article will analyze market trends over the next 2-3 trading days from two different perspectives: the impact of US Treasury yield changes on the US dollar and the transmission mechanism of risk aversion from the bond market to the gold market.

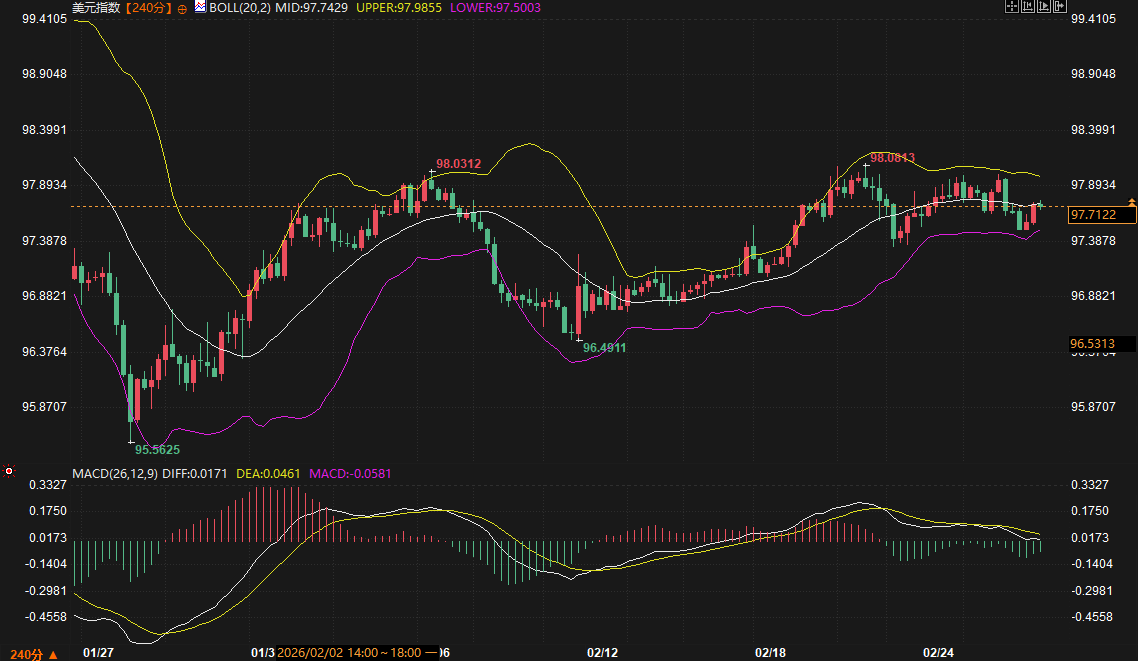
From a technical perspective, observing the 240-minute candlestick chart of the US dollar index, the current price (97.7088) is trading below the Bollinger Band middle line (97.7427), indicating weak short-term momentum. It's worth noting that the Bollinger Bands have expanded again after a period of narrowing, with the upper band pointing to 97.9855 and the lower band extending to 97.5000, which typically foreshadows a significant increase in volatility. Regarding the MACD indicator, the DIFF (0.0168) and DEA (0.0461) are still in a death cross, but the negative histogram bars have been shortening, indicating that the downward momentum is weakening, and the market may be facing a directional decision in the short term.
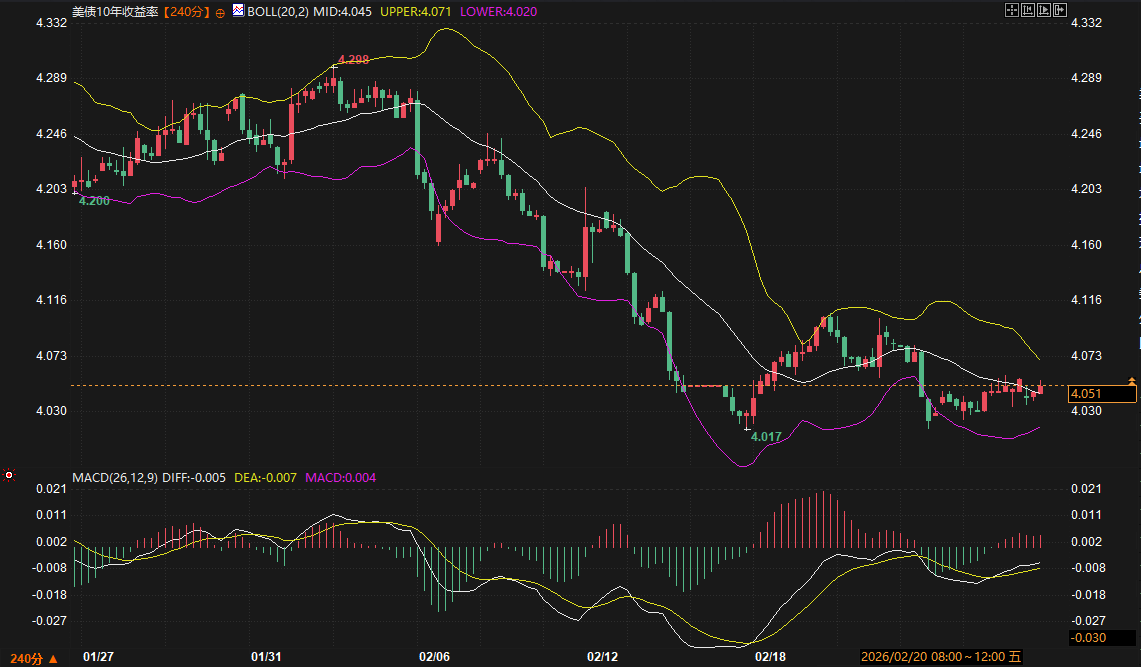
The core variable influencing the dollar's trajectory is shifting from simple interest rate expectations to the supply and demand structure of the US Treasury market. Yesterday, the US Treasury auctioned $70 billion in 5-year Treasury notes, with a final winning bid rate of 3.615%, a 0.7 basis point "tail spread" compared to the market yield at the bid deadline. Furthermore, the combined allocation ratio for indirect and direct bidders fell to 87.2%, the lowest level since March 2025. This weak auction result indicates that, given the uncertainty surrounding tariff policies and the clarification of the global trade situation, overseas institutions and domestic long-term funds are cautious about adding new US Treasury positions. Weak demand in the primary market typically suppresses secondary market sentiment, thus limiting the downside potential of US Treasury yields. However, the current market exhibits an alternative logic of "bad news is good news"—marginal weakening economic data and geopolitical risks have actually strengthened safe-haven buying, pushing the 10-year US Treasury yield closer to its recent low of 4.04%.
The decline in US Treasury yields has directly weakened the dollar's interest rate advantage. Especially when key maturities on the yield curve (such as 5-year and 7-year maturities) remain under pressure, the attractiveness of dollar assets to cross-border capital will marginally decrease. Analysts from well-known institutions point out that although recent statements from Federal Reserve officials have been divergent (e.g., Schmid emphasized that the inflation work is not yet complete, while Musslump believes that inflation and employment risks are roughly balanced), the market is clearly more focused on whether Bowman's remarks on regulation at today's Senate hearing will indirectly reveal his assessment of the economic outlook. If US Treasury yields effectively break below the 4.03% support level, the dollar index will likely further test the 97.50 level.
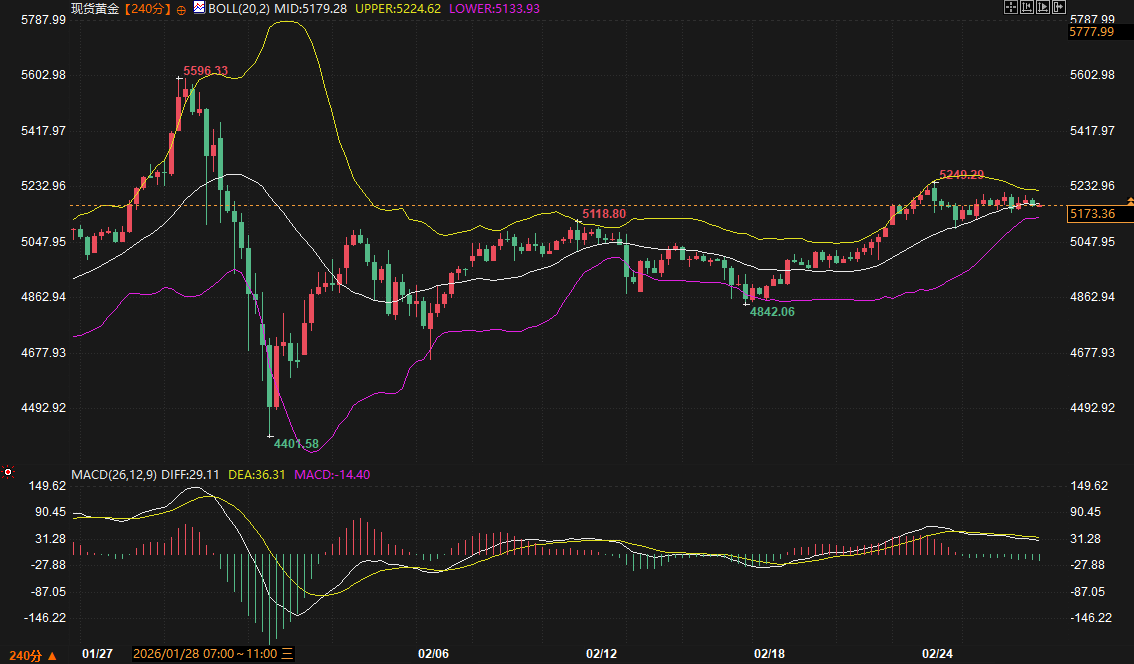
Spot gold found buying support after its recent pullback to around $5173/oz, with the 240-minute chart showing prices fluctuating around the Bollinger Band middle line ($5179.27). Although the MACD indicator remains in negative territory (hiblies -14.42), the fast line (DIFF) has begun to flatten, indicating a clear weakening of bearish momentum. The downward pressure established at the previous high of $5596.13 is being digested over time, while the key support level of $4842.06 provides a safety net for the medium-term bulls.
Unlike conventional analyses that focus on the negative correlation between the US dollar and gold, current gold pricing logic is more driven by risk aversion in the bond market. Yesterday's IFR news bulletin explicitly pointed out that "despite flat yields, there is still buying interest in US Treasuries due to uncertainties ranging from tariffs to the Iran issue." This "uncertainty buying" is spilling over into the gold market. On the one hand, lower real yields on US Treasuries reduce the opportunity cost of holding gold; on the other hand, the tough demands made by the US in the Iran nuclear negotiations and Trump's warnings to Iran in his State of the Union address have caused the geopolitical conflict risk premium to be re-included in gold prices. Carlo Alberto De Casa, an external analyst at Quote Bank in Switzerland, bluntly stated, "The ongoing tensions between Iran and the US, coupled with the global economic uncertainty caused by Trump's tariffs, are bullish catalysts for gold."
Furthermore, while the European Central Bank's reserve adjustment did not directly target gold, the signals it sent are noteworthy. In the first quarter of 2025, the ECB sold some of its dollar assets and allocated the proceeds to the Japanese yen. Although officially described as a "standard rebalancing," this move occurred before the market turmoil triggered by tariff policies, objectively reflecting a rethinking of the concentration of dollar assets by major central banks. This marginal move towards global "de-dollarization," coupled with reports of continued gold purchases by central banks in Asia and other countries, together forms the micro-foundation for a medium- to long-term bull market in gold.
Bank of Japan Governor Kazuo Ueda gave a hawkish signal in an interview early this morning, stating that decisions at the March and April meetings would be based on available information and that it was not necessary to wait for the Tankan survey on April 1. This statement initially pushed up Japanese government bond yields and strengthened the yen. However, the market reaction was relatively restrained, with the 10-year Japanese government bond yield rising only moderately by 3 basis points to 2.165%, indicating that investors still have doubts about whether the Bank of Japan can truly tighten monetary policy under the Prime Minister's preferred easing environment.
For the global bond market, the volatility of the yen and the rise in Japanese government bond yields have not yet posed a substantial impact. On the one hand, the selling pressure on ultra-long-term government bonds by Japanese buy-side institutions (such as life insurance companies) has eased, as accounting rule adjustments have reduced their urgency to liquidate low-coupon older bonds. On the other hand, end-of-month demand for extended duration continues to support long-term bonds. This means that the risk of capital outflows from Japan is manageable in the short term, and the core drivers of the US Treasury market will remain focused on US inflation data and fiscal auction results.
US Treasury (10-year): It is expected to trade primarily within the 4.02% to 4.07% range over the next two trading days. The rationale for this range is as follows: 4.02% corresponds to the lower Bollinger Band and the lower edge of the previous densely traded area; without new safe-haven events, a significant break below this level is unlikely. 4.07% represents the high point before and after yesterday's auction and a short-term moving average resistance level. Key data to watch during the session includes weekly initial jobless claims (expected 215,000) and demand for tonight's $44 billion 7-year Treasury auction. If the initial claims data is lower than expected and demand for the 7-year auction remains robust, yields may test the range resistance level upwards.
US Dollar Index: Expected trading range is 97.50 to 98.00. 97.50 corresponds to the lower Bollinger Band on the 240-minute chart and a psychological level, while the psychological level of 98.00 coincides with the upper Bollinger Band resistance. If US Treasury yields fail to break upwards, the US Dollar Index is unlikely to strengthen independently.
Spot gold: The expected trading range is $5130-$5225. $5130 corresponds to the area above the lower Bollinger Band on the 240-minute chart, which is also the area where buying support has emerged during recent pullbacks; $5225 is the upper Bollinger Band resistance level. If US Treasury yields fall further below 4.02% or if new tensions emerge in the Iranian situation, gold prices may test the upper limit of the range.
Overall, the market is currently in a period of uncertainty surrounding macroeconomic data and geopolitical events. The direction of US Treasury yields will directly determine the short-term trend of the US dollar and gold, while the safe-haven logic clearly prevails in the current environment. In the next 2-3 trading days, investors need to closely monitor marginal changes in US employment data, indirect demand indicators from Treasury auctions, and the real-time progress of the Iran nuclear negotiations.
The flattening of the US Treasury yield curve has weakened the upward momentum of the US dollar.
From a technical perspective, observing the 240-minute candlestick chart of the US dollar index, the current price (97.7088) is trading below the Bollinger Band middle line (97.7427), indicating weak short-term momentum. It's worth noting that the Bollinger Bands have expanded again after a period of narrowing, with the upper band pointing to 97.9855 and the lower band extending to 97.5000, which typically foreshadows a significant increase in volatility. Regarding the MACD indicator, the DIFF (0.0168) and DEA (0.0461) are still in a death cross, but the negative histogram bars have been shortening, indicating that the downward momentum is weakening, and the market may be facing a directional decision in the short term.
The core variable influencing the dollar's trajectory is shifting from simple interest rate expectations to the supply and demand structure of the US Treasury market. Yesterday, the US Treasury auctioned $70 billion in 5-year Treasury notes, with a final winning bid rate of 3.615%, a 0.7 basis point "tail spread" compared to the market yield at the bid deadline. Furthermore, the combined allocation ratio for indirect and direct bidders fell to 87.2%, the lowest level since March 2025. This weak auction result indicates that, given the uncertainty surrounding tariff policies and the clarification of the global trade situation, overseas institutions and domestic long-term funds are cautious about adding new US Treasury positions. Weak demand in the primary market typically suppresses secondary market sentiment, thus limiting the downside potential of US Treasury yields. However, the current market exhibits an alternative logic of "bad news is good news"—marginal weakening economic data and geopolitical risks have actually strengthened safe-haven buying, pushing the 10-year US Treasury yield closer to its recent low of 4.04%.
The decline in US Treasury yields has directly weakened the dollar's interest rate advantage. Especially when key maturities on the yield curve (such as 5-year and 7-year maturities) remain under pressure, the attractiveness of dollar assets to cross-border capital will marginally decrease. Analysts from well-known institutions point out that although recent statements from Federal Reserve officials have been divergent (e.g., Schmid emphasized that the inflation work is not yet complete, while Musslump believes that inflation and employment risks are roughly balanced), the market is clearly more focused on whether Bowman's remarks on regulation at today's Senate hearing will indirectly reveal his assessment of the economic outlook. If US Treasury yields effectively break below the 4.03% support level, the dollar index will likely further test the 97.50 level.
Bond market risk aversion signals strengthened, providing multi-dimensional support for gold.
Spot gold found buying support after its recent pullback to around $5173/oz, with the 240-minute chart showing prices fluctuating around the Bollinger Band middle line ($5179.27). Although the MACD indicator remains in negative territory (hiblies -14.42), the fast line (DIFF) has begun to flatten, indicating a clear weakening of bearish momentum. The downward pressure established at the previous high of $5596.13 is being digested over time, while the key support level of $4842.06 provides a safety net for the medium-term bulls.
Unlike conventional analyses that focus on the negative correlation between the US dollar and gold, current gold pricing logic is more driven by risk aversion in the bond market. Yesterday's IFR news bulletin explicitly pointed out that "despite flat yields, there is still buying interest in US Treasuries due to uncertainties ranging from tariffs to the Iran issue." This "uncertainty buying" is spilling over into the gold market. On the one hand, lower real yields on US Treasuries reduce the opportunity cost of holding gold; on the other hand, the tough demands made by the US in the Iran nuclear negotiations and Trump's warnings to Iran in his State of the Union address have caused the geopolitical conflict risk premium to be re-included in gold prices. Carlo Alberto De Casa, an external analyst at Quote Bank in Switzerland, bluntly stated, "The ongoing tensions between Iran and the US, coupled with the global economic uncertainty caused by Trump's tariffs, are bullish catalysts for gold."
Furthermore, while the European Central Bank's reserve adjustment did not directly target gold, the signals it sent are noteworthy. In the first quarter of 2025, the ECB sold some of its dollar assets and allocated the proceeds to the Japanese yen. Although officially described as a "standard rebalancing," this move occurred before the market turmoil triggered by tariff policies, objectively reflecting a rethinking of the concentration of dollar assets by major central banks. This marginal move towards global "de-dollarization," coupled with reports of continued gold purchases by central banks in Asia and other countries, together forms the micro-foundation for a medium- to long-term bull market in gold.
The Bank of Japan's policy expectations are fluctuating, but the safe-haven logic is currently dominant.
Bank of Japan Governor Kazuo Ueda gave a hawkish signal in an interview early this morning, stating that decisions at the March and April meetings would be based on available information and that it was not necessary to wait for the Tankan survey on April 1. This statement initially pushed up Japanese government bond yields and strengthened the yen. However, the market reaction was relatively restrained, with the 10-year Japanese government bond yield rising only moderately by 3 basis points to 2.165%, indicating that investors still have doubts about whether the Bank of Japan can truly tighten monetary policy under the Prime Minister's preferred easing environment.
For the global bond market, the volatility of the yen and the rise in Japanese government bond yields have not yet posed a substantial impact. On the one hand, the selling pressure on ultra-long-term government bonds by Japanese buy-side institutions (such as life insurance companies) has eased, as accounting rule adjustments have reduced their urgency to liquidate low-coupon older bonds. On the other hand, end-of-month demand for extended duration continues to support long-term bonds. This means that the risk of capital outflows from Japan is manageable in the short term, and the core drivers of the US Treasury market will remain focused on US inflation data and fiscal auction results.
Forecast of the trend range and key points to watch in the next 2-3 days
US Treasury (10-year): It is expected to trade primarily within the 4.02% to 4.07% range over the next two trading days. The rationale for this range is as follows: 4.02% corresponds to the lower Bollinger Band and the lower edge of the previous densely traded area; without new safe-haven events, a significant break below this level is unlikely. 4.07% represents the high point before and after yesterday's auction and a short-term moving average resistance level. Key data to watch during the session includes weekly initial jobless claims (expected 215,000) and demand for tonight's $44 billion 7-year Treasury auction. If the initial claims data is lower than expected and demand for the 7-year auction remains robust, yields may test the range resistance level upwards.
US Dollar Index: Expected trading range is 97.50 to 98.00. 97.50 corresponds to the lower Bollinger Band on the 240-minute chart and a psychological level, while the psychological level of 98.00 coincides with the upper Bollinger Band resistance. If US Treasury yields fail to break upwards, the US Dollar Index is unlikely to strengthen independently.
Spot gold: The expected trading range is $5130-$5225. $5130 corresponds to the area above the lower Bollinger Band on the 240-minute chart, which is also the area where buying support has emerged during recent pullbacks; $5225 is the upper Bollinger Band resistance level. If US Treasury yields fall further below 4.02% or if new tensions emerge in the Iranian situation, gold prices may test the upper limit of the range.
Overall, the market is currently in a period of uncertainty surrounding macroeconomic data and geopolitical events. The direction of US Treasury yields will directly determine the short-term trend of the US dollar and gold, while the safe-haven logic clearly prevails in the current environment. In the next 2-3 trading days, investors need to closely monitor marginal changes in US employment data, indirect demand indicators from Treasury auctions, and the real-time progress of the Iran nuclear negotiations.
- Risk Warning and Disclaimer
- The market involves risk, and trading may not be suitable for all investors. This article is for reference only and does not constitute personal investment advice, nor does it take into account certain users’ specific investment objectives, financial situation, or other needs. Any investment decisions made based on this information are at your own risk.