Soaring oil prices: History repeating itself or a new script? Unveiling the "flash crash" curse under geopolitical crises.
2026-03-02 16:58:07
On Monday, March 2nd, a cold front from the Middle East swept across global trading floors. The sudden escalation of geopolitical tensions, like a boulder thrown into a calm lake, created ripples and instantly became the focus of global investors' attention. The eye of this storm threatened the very lifeline of the energy market, causing a dramatic price gap in crude oil.
Initially, panic drove US crude oil prices soaring to a high of $75 per barrel, as if the market had already foreseen the apocalyptic scenario of supply disruptions. However, this frenzy did not last long. As the first wave of sentiment subsided, prices quickly fell back, eventually settling into a volatile trading range around $70. This dramatic initial move vividly demonstrated the energy market's almost instinctive sensitivity to geopolitical risks.
Especially when tensions loom over the Strait of Hormuz, market nerves are stretched to the limit. This narrow waterway is a vital choke point for global energy flows, with approximately one-fifth of the world's oil supply passing through it. For traders, even the mere possibility of a blockade is enough to force a significant supply risk premium into prices. This rapid injection of risk premium is essentially a defensive mechanism activated by the market in the face of high uncertainty. Analysts point out that the current price surge is not entirely based on actual supply shortages, but rather on the fear of "what if." In this atmosphere, any news about escalating conflict is amplified, pushing prices away from fundamentals in a short period, creating a false boom driven by emotion.
While the current surge is remarkable, a review of historical records shows that such price spikes triggered by geopolitical crises are often characterized by being "intense but short-lived." In the script of geopolitical crises, oil prices typically react most violently at the onset of conflict, but whether this surge can be sustained remains a huge question mark. Looking back at the Gulf War, from August 1990 to February 1991, oil prices skyrocketed by nearly 97% due to traders' extreme fears of a devastating blow to Middle Eastern supplies. However, once the situation stabilized, or the market discovered that actual supplies had not been cut off as expected, prices dramatically reversed, ultimately falling by more than 50% in January 1991, wiping out all previous gains.
A similar scenario played out during the Russia-Ukraine conflict in February 2022. At that time, crude oil prices surged by approximately 35% in March, marking a remarkable monthly increase. However, as the market gradually adapted to the new supply environment and confirmed that actual logistics were not completely paralyzed, prices also declined. This recurring dynamic reveals a core logic of the commodity market: geopolitical shocks often create immediate "supply fears" rather than long-term "supply facts." Once the market clarifies whether actual production or transportation is truly disrupted, price bubbles built on sentiment will quickly burst. Analysis emphasizes that investors must be aware that sentiment-driven fluctuations lacking solid fundamental support are unlikely to sustain a long-term upward trend, and blindly chasing highs often means becoming the bagholder.
The current market situation appears to be strictly following the early stages of the aforementioned historical pattern. While oil prices briefly surged to $75 due to concerns about the closure of the Strait of Hormuz, the strait has not yet been officially closed, and there are no signs of a complete standstill in shipping traffic. This indicates that the market is currently pricing in only "disruption risk," rather than confirmed "supply loss," which explains why oil prices quickly retreated to the lower $70 range for consolidation. Crude oil prices are approaching a crucial technical battleground. The weekly chart shows that oil prices previously rebounded strongly from the $55 area, a defensive line heavily defended by buyers earlier this year. Prices then rose to the mid-$60 range and broke through the key resistance level of $67, which had long suppressed the rebound, seemingly suggesting a trend reversal.
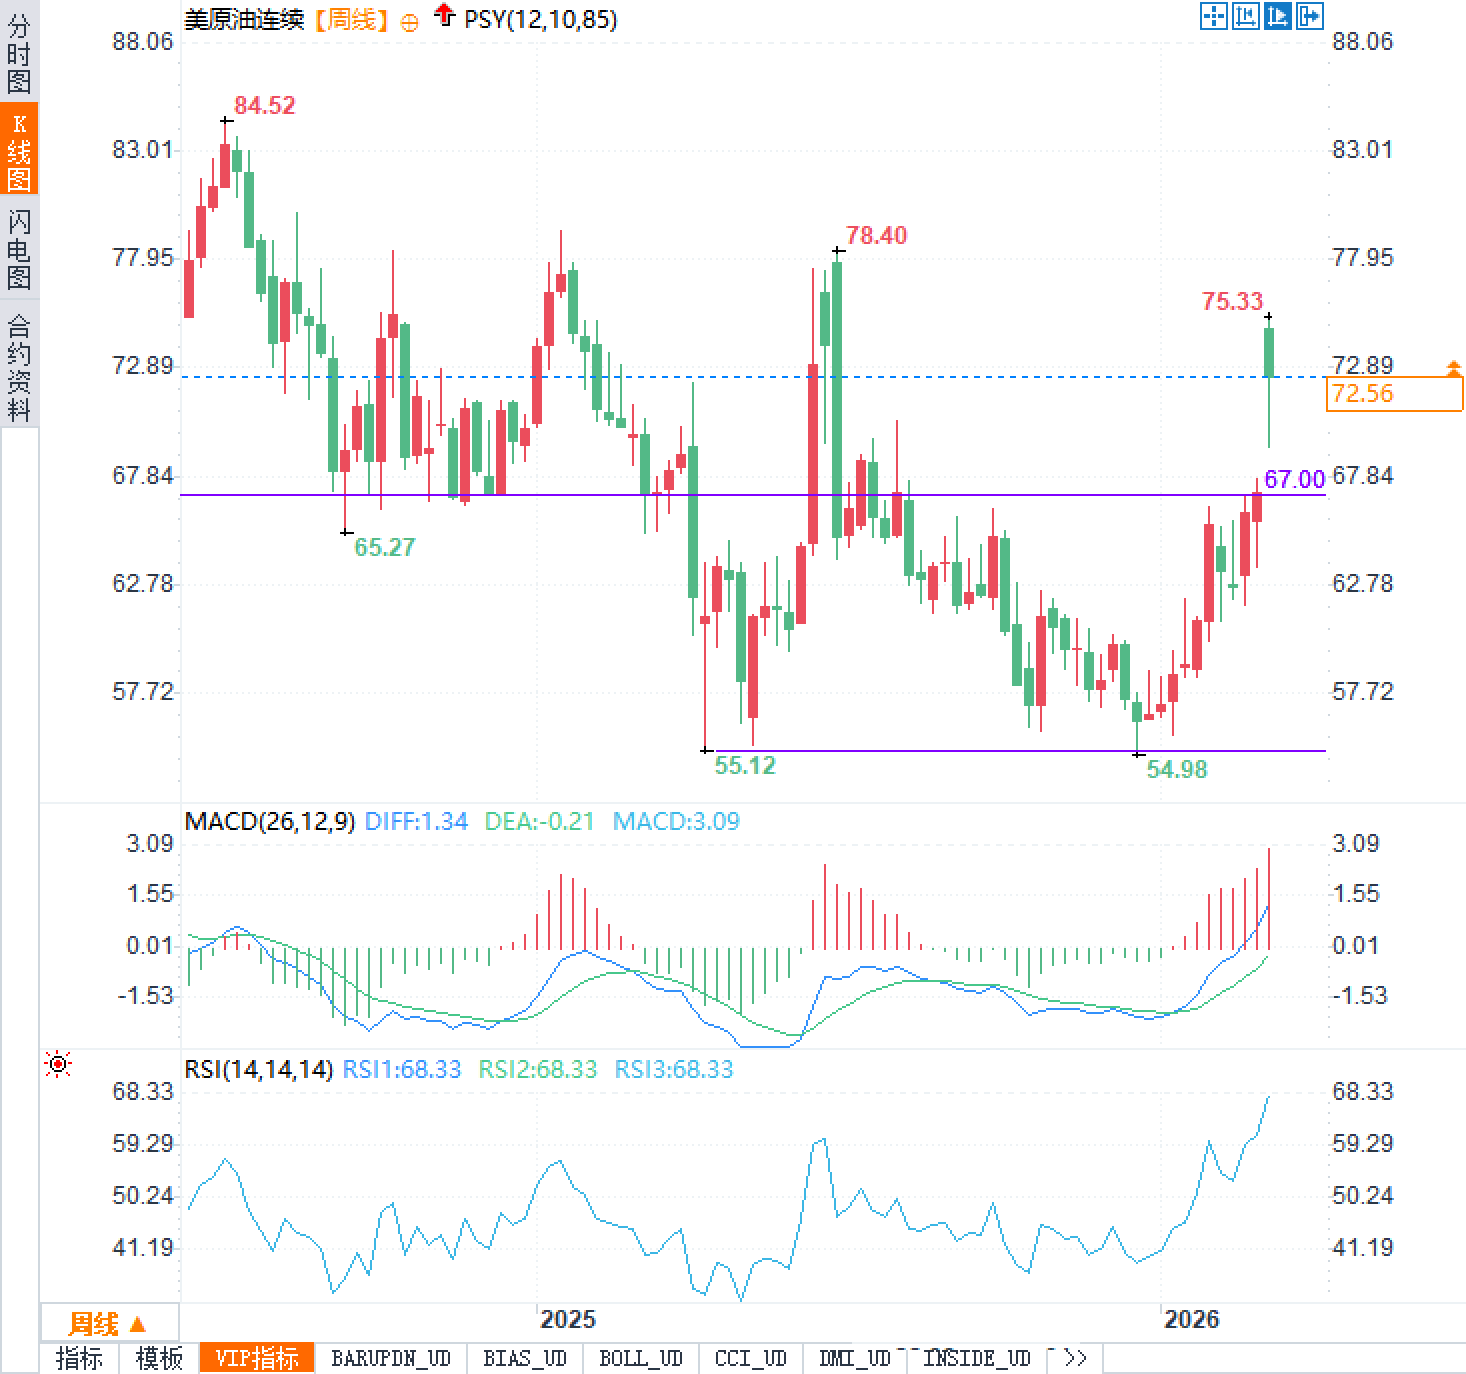
The $67 level has become a fiercely contested battleground for both bulls and bears for three reasons: First, it lies near the 38.2% Fibonacci retracement level, possessing natural technical support significance; second, it perfectly aligns with the downtrend line that has been limiting oil price rebounds since 2023; and finally, it represents a stagnation level where previous rallies have repeatedly failed. Analysts believe that if crude oil can firmly hold this breakout area, the next resistance target will be around $77, a key pivot level in the past, and a continued breakout could even open the door to $83 or even $92 (the previous high). However, the risks are equally significant. If prices fail to hold the $67 breakout, this rally could prove to be another typical geopolitical "false breakout." With tensions still escalating and the Strait of Hormuz remaining open, traders are holding their breath, closely watching this drama, orchestrated by both sentiment and technical factors, to see if it will develop into a sustained bullish breakout or dissipate as the fog clears.
Initially, panic drove US crude oil prices soaring to a high of $75 per barrel, as if the market had already foreseen the apocalyptic scenario of supply disruptions. However, this frenzy did not last long. As the first wave of sentiment subsided, prices quickly fell back, eventually settling into a volatile trading range around $70. This dramatic initial move vividly demonstrated the energy market's almost instinctive sensitivity to geopolitical risks.
Especially when tensions loom over the Strait of Hormuz, market nerves are stretched to the limit. This narrow waterway is a vital choke point for global energy flows, with approximately one-fifth of the world's oil supply passing through it. For traders, even the mere possibility of a blockade is enough to force a significant supply risk premium into prices. This rapid injection of risk premium is essentially a defensive mechanism activated by the market in the face of high uncertainty. Analysts point out that the current price surge is not entirely based on actual supply shortages, but rather on the fear of "what if." In this atmosphere, any news about escalating conflict is amplified, pushing prices away from fundamentals in a short period, creating a false boom driven by emotion.
Historical Lessons: Why Panic Surges Often End Up Short-Lived
While the current surge is remarkable, a review of historical records shows that such price spikes triggered by geopolitical crises are often characterized by being "intense but short-lived." In the script of geopolitical crises, oil prices typically react most violently at the onset of conflict, but whether this surge can be sustained remains a huge question mark. Looking back at the Gulf War, from August 1990 to February 1991, oil prices skyrocketed by nearly 97% due to traders' extreme fears of a devastating blow to Middle Eastern supplies. However, once the situation stabilized, or the market discovered that actual supplies had not been cut off as expected, prices dramatically reversed, ultimately falling by more than 50% in January 1991, wiping out all previous gains.
A similar scenario played out during the Russia-Ukraine conflict in February 2022. At that time, crude oil prices surged by approximately 35% in March, marking a remarkable monthly increase. However, as the market gradually adapted to the new supply environment and confirmed that actual logistics were not completely paralyzed, prices also declined. This recurring dynamic reveals a core logic of the commodity market: geopolitical shocks often create immediate "supply fears" rather than long-term "supply facts." Once the market clarifies whether actual production or transportation is truly disrupted, price bubbles built on sentiment will quickly burst. Analysis emphasizes that investors must be aware that sentiment-driven fluctuations lacking solid fundamental support are unlikely to sustain a long-term upward trend, and blindly chasing highs often means becoming the bagholder.
Key Game: Choosing Between Technological Defenses and Future Paths
The current market situation appears to be strictly following the early stages of the aforementioned historical pattern. While oil prices briefly surged to $75 due to concerns about the closure of the Strait of Hormuz, the strait has not yet been officially closed, and there are no signs of a complete standstill in shipping traffic. This indicates that the market is currently pricing in only "disruption risk," rather than confirmed "supply loss," which explains why oil prices quickly retreated to the lower $70 range for consolidation. Crude oil prices are approaching a crucial technical battleground. The weekly chart shows that oil prices previously rebounded strongly from the $55 area, a defensive line heavily defended by buyers earlier this year. Prices then rose to the mid-$60 range and broke through the key resistance level of $67, which had long suppressed the rebound, seemingly suggesting a trend reversal.
The $67 level has become a fiercely contested battleground for both bulls and bears for three reasons: First, it lies near the 38.2% Fibonacci retracement level, possessing natural technical support significance; second, it perfectly aligns with the downtrend line that has been limiting oil price rebounds since 2023; and finally, it represents a stagnation level where previous rallies have repeatedly failed. Analysts believe that if crude oil can firmly hold this breakout area, the next resistance target will be around $77, a key pivot level in the past, and a continued breakout could even open the door to $83 or even $92 (the previous high). However, the risks are equally significant. If prices fail to hold the $67 breakout, this rally could prove to be another typical geopolitical "false breakout." With tensions still escalating and the Strait of Hormuz remaining open, traders are holding their breath, closely watching this drama, orchestrated by both sentiment and technical factors, to see if it will develop into a sustained bullish breakout or dissipate as the fog clears.
- Risk Warning and Disclaimer
- The market involves risk, and trading may not be suitable for all investors. This article is for reference only and does not constitute personal investment advice, nor does it take into account certain users’ specific investment objectives, financial situation, or other needs. Any investment decisions made based on this information are at your own risk.