Gold prices retreated as profit-taking and a stronger dollar offset geopolitical support.
2026-03-03 20:02:58
Gold prices retreated from near record highs during the European session on Tuesday (March 3) amid tensions in the Middle East, with spot prices falling approximately 3.5% today, influenced by a stronger dollar, rising US Treasury yields, and profit-taking pressure. Despite continued risk premiums from volatile oil prices, gold's reaction shifted towards a pullback. The options market still shows a cautiously bullish bias, but short-term hedging demand is dominant.

Gold retreated from near-record highs due to ongoing tensions in the Middle East (including US-Israeli actions against Iran and the threat posed by the Strait of Hormuz), a stronger dollar, and rising Treasury yields. Spot gold fell about 3.5% during the session. While volatility in crude oil continued to inject risk premiums, gold reacted with profit-taking. The options market remained cautiously bullish, but short-term hedging demand dominated.
Gold initially held firm, driven by Middle East geopolitical headlines, including Iran's threat to block the Strait of Hormuz, even briefly testing highs above $5,380. Brent crude surged as much as 13% in early trading (before retreating somewhat from its intraday high of nearly $82), providing support for safe-haven demand.
Gold subsequently gave back its gains and is currently trading around $5,150. This reflects profit-taking after the recent sharp rise, the dollar hitting a one-month high (making gold more expensive for non-dollar buyers), and expectations of higher interest rates diminishing the appeal of non-interest-bearing assets.
Despite the impact of Middle East geopolitical events on crude oil (including Iran's vow to effectively block the Strait of Hormuz), gold initially maintained an upward trend. However, spot gold has retreated to the $5250-$5270 range today, down 1.3-1.5% from its intraday high.
This reflects profit-taking after the recent surge, while a stronger dollar (reaching a one-month high) and rising expectations of the Federal Reserve maintaining interest rates (the probability of keeping rates stable in June has risen to over 60%) have diminished gold's appeal. Market sentiment has shifted: gold remains supported by geopolitics, but short-term momentum is weakening, and a breakout pattern is not emerging.
Gold is supported by energy risks, but faces short-term pressure.
Crude oil remains the asset most directly affected by the situation in the Middle East. Brent crude oil consolidated after a surge in the morning session (currently around $76-80, with some risk premium retracing).
For gold, a brief surge in oil prices supported safe-haven demand, but today's pullback highlights a stronger dollar, inflation concerns (rising energy costs), and a decline in the attractiveness of non-interest-bearing assets, limiting upside potential without further escalation.
As long as oil risk premiums remain high due to the Middle East situation, precious metals may retain geopolitical buying interest. However, today's gold decline indicates that a stronger dollar, rising US Treasury yields, and the possibility that the Federal Reserve may maintain high interest rates for a longer period are offsetting some safe-haven demand. Without further escalation, gold's momentum is unlikely to accelerate, and consolidation or a pullback is currently more probable.
Maintain caution in options positions amid volatility.
Risk reversal indicators continue to show polarization. The near-term (1-week 10-delta) indicator remains negative, indicating that traders are paying a premium for short-term downside protection (strong demand for put options), which is consistent with recent volatility and long upper and lower shadows on candlesticks – market pricing volatility rather than a one-sided upward trend.
The medium- to long-term (1-month) risk reversal indicator is positive, and the demand for call options exceeds that for put options, indicating that institutions expect prices to rise in the coming weeks while hedging against short-term risks—this is a protected upside exposure rather than blindly optimistic buying.
Technical Analysis
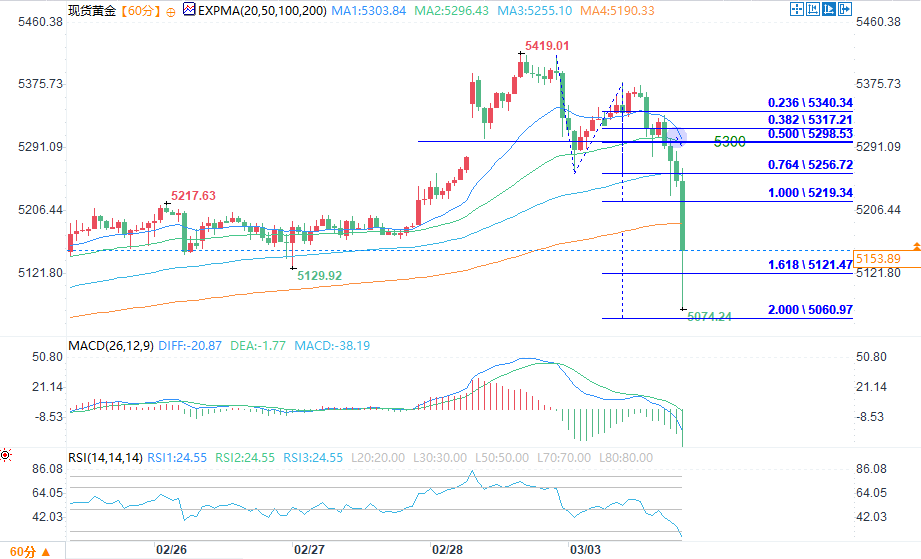
(Spot gold 1-hour chart source: EasyForex)
Looking at the price structure of the 60-minute chart for spot gold, the price previously surged to a high of 5419.01 before undergoing a deep correction, falling to a low of 5074.24.
The current price is hovering around the 1.618 Fibonacci retracement level at 5121.47, which serves as a key short-term support level. The 0.500 Fibonacci retracement level at 5298.53, the 0.382 Fibonacci retracement level at 5317.21, and the 0.236 Fibonacci retracement level at 5340.34 form a stepped resistance level for any rebound. The 1.000 Fibonacci retracement level at 5219.34 coincides with the previous low and is a significant dividing line in the downtrend.
The moving average system (EXPMA) and key levels on the wave scale form a strong resonance effect, becoming the core basis for judging the strength of the trend. In the chart, the 20-period (5302.75) and 50-period (5295.98) short-term moving averages highly overlap with the 0.500 retracement level of the wave scale at 5298.53, forming a dense resistance zone; the 100-period moving average at 5254.34 corresponds to the 0.764 retracement level at 5256.72, while the 200-period moving average at 5187.99 is located between the 1.000 retracement level and the 1.618 extension level.
The current price has fallen sharply below all short- and medium-term moving averages, which are showing a clear bearish alignment. This pattern, along with the downward structure shown by the wave gauge, confirms the dominance of the short-term bearish trend.
Combining technical indicators and volume-price relationships, the MACD indicator shows the DIFF line (-21.78) deeply crossing below the DEA line (-1.95), with the green momentum bars continuing to expand, confirming the continued release of bearish momentum. The RSI indicator value has dropped to 23.71, entering the oversold zone, indicating the possibility of a short-term technical rebound. However, the oversold signal has not changed the bearish pattern jointly established by the moving averages and the wave indicator.
In summary, the key price levels of the wave gauge and the resonance area of the moving average system provide clear anchor points for trading decisions. If prices rebound in the short term, the 5298.53-5302.75 (0.500 retracement level + 20/50-period moving averages) will be the strongest resistance zone. If the rebound encounters resistance at this level, it will be a key entry point to follow the downtrend. On the downside, the effectiveness of the support at 5121.47 (1.618 extension level) needs to be closely monitored. If this level is breached, the price will likely test the 2.000 extension level at 5060.97 further. The 200-period moving average at 5187.99 can serve as a secondary resistance reference during any rebound.
At 19:57 Beijing time, spot gold was trading at $5,143.32 per ounce, down 3.36%.
Gold retreated from near-record highs due to ongoing tensions in the Middle East (including US-Israeli actions against Iran and the threat posed by the Strait of Hormuz), a stronger dollar, and rising Treasury yields. Spot gold fell about 3.5% during the session. While volatility in crude oil continued to inject risk premiums, gold reacted with profit-taking. The options market remained cautiously bullish, but short-term hedging demand dominated.
Gold initially held firm, driven by Middle East geopolitical headlines, including Iran's threat to block the Strait of Hormuz, even briefly testing highs above $5,380. Brent crude surged as much as 13% in early trading (before retreating somewhat from its intraday high of nearly $82), providing support for safe-haven demand.
Gold subsequently gave back its gains and is currently trading around $5,150. This reflects profit-taking after the recent sharp rise, the dollar hitting a one-month high (making gold more expensive for non-dollar buyers), and expectations of higher interest rates diminishing the appeal of non-interest-bearing assets.
Despite the impact of Middle East geopolitical events on crude oil (including Iran's vow to effectively block the Strait of Hormuz), gold initially maintained an upward trend. However, spot gold has retreated to the $5250-$5270 range today, down 1.3-1.5% from its intraday high.
This reflects profit-taking after the recent surge, while a stronger dollar (reaching a one-month high) and rising expectations of the Federal Reserve maintaining interest rates (the probability of keeping rates stable in June has risen to over 60%) have diminished gold's appeal. Market sentiment has shifted: gold remains supported by geopolitics, but short-term momentum is weakening, and a breakout pattern is not emerging.
Gold is supported by energy risks, but faces short-term pressure.
Crude oil remains the asset most directly affected by the situation in the Middle East. Brent crude oil consolidated after a surge in the morning session (currently around $76-80, with some risk premium retracing).
For gold, a brief surge in oil prices supported safe-haven demand, but today's pullback highlights a stronger dollar, inflation concerns (rising energy costs), and a decline in the attractiveness of non-interest-bearing assets, limiting upside potential without further escalation.
As long as oil risk premiums remain high due to the Middle East situation, precious metals may retain geopolitical buying interest. However, today's gold decline indicates that a stronger dollar, rising US Treasury yields, and the possibility that the Federal Reserve may maintain high interest rates for a longer period are offsetting some safe-haven demand. Without further escalation, gold's momentum is unlikely to accelerate, and consolidation or a pullback is currently more probable.
Maintain caution in options positions amid volatility.
Risk reversal indicators continue to show polarization. The near-term (1-week 10-delta) indicator remains negative, indicating that traders are paying a premium for short-term downside protection (strong demand for put options), which is consistent with recent volatility and long upper and lower shadows on candlesticks – market pricing volatility rather than a one-sided upward trend.
The medium- to long-term (1-month) risk reversal indicator is positive, and the demand for call options exceeds that for put options, indicating that institutions expect prices to rise in the coming weeks while hedging against short-term risks—this is a protected upside exposure rather than blindly optimistic buying.
Technical Analysis
(Spot gold 1-hour chart source: EasyForex)
Looking at the price structure of the 60-minute chart for spot gold, the price previously surged to a high of 5419.01 before undergoing a deep correction, falling to a low of 5074.24.
The current price is hovering around the 1.618 Fibonacci retracement level at 5121.47, which serves as a key short-term support level. The 0.500 Fibonacci retracement level at 5298.53, the 0.382 Fibonacci retracement level at 5317.21, and the 0.236 Fibonacci retracement level at 5340.34 form a stepped resistance level for any rebound. The 1.000 Fibonacci retracement level at 5219.34 coincides with the previous low and is a significant dividing line in the downtrend.
The moving average system (EXPMA) and key levels on the wave scale form a strong resonance effect, becoming the core basis for judging the strength of the trend. In the chart, the 20-period (5302.75) and 50-period (5295.98) short-term moving averages highly overlap with the 0.500 retracement level of the wave scale at 5298.53, forming a dense resistance zone; the 100-period moving average at 5254.34 corresponds to the 0.764 retracement level at 5256.72, while the 200-period moving average at 5187.99 is located between the 1.000 retracement level and the 1.618 extension level.
The current price has fallen sharply below all short- and medium-term moving averages, which are showing a clear bearish alignment. This pattern, along with the downward structure shown by the wave gauge, confirms the dominance of the short-term bearish trend.
Combining technical indicators and volume-price relationships, the MACD indicator shows the DIFF line (-21.78) deeply crossing below the DEA line (-1.95), with the green momentum bars continuing to expand, confirming the continued release of bearish momentum. The RSI indicator value has dropped to 23.71, entering the oversold zone, indicating the possibility of a short-term technical rebound. However, the oversold signal has not changed the bearish pattern jointly established by the moving averages and the wave indicator.
In summary, the key price levels of the wave gauge and the resonance area of the moving average system provide clear anchor points for trading decisions. If prices rebound in the short term, the 5298.53-5302.75 (0.500 retracement level + 20/50-period moving averages) will be the strongest resistance zone. If the rebound encounters resistance at this level, it will be a key entry point to follow the downtrend. On the downside, the effectiveness of the support at 5121.47 (1.618 extension level) needs to be closely monitored. If this level is breached, the price will likely test the 2.000 extension level at 5060.97 further. The 200-period moving average at 5187.99 can serve as a secondary resistance reference during any rebound.
At 19:57 Beijing time, spot gold was trading at $5,143.32 per ounce, down 3.36%.
- Risk Warning and Disclaimer
- The market involves risk, and trading may not be suitable for all investors. This article is for reference only and does not constitute personal investment advice, nor does it take into account certain users’ specific investment objectives, financial situation, or other needs. Any investment decisions made based on this information are at your own risk.