Why did aluminum prices collapse even though the fighting in the Middle East has not stopped?
2026-03-03 21:10:29
Table of Contents
- Market Overview
- Fundamental analysis
- Technical Analysis
- Support and resistance range prediction
- Future Trend Outlook
On Tuesday (March 3), aluminum futures strengthened significantly, driven by supply concerns stemming from conflicts in the Middle East. The benchmark aluminum contract on the London Metal Exchange rose 0.6% to $3213.50 per tonne, having earlier touched a high of $3254 per tonne, the highest level since January 29, reflecting heightened market participants' awareness of potential supply bottlenecks.

Market Overview
Aluminum futures are currently exhibiting a slightly bullish but volatile pattern, with prices fluctuating more sharply within a high range. The benchmark contract has steadily rebounded from recent lows, reaching a high of $3254 before slightly retreating to around $3213.50, with overall trading activity increasing. The global aluminum market's focus is on the disruptions to the supply chain caused by geopolitical factors. The Middle East, as a major producing region, accounts for 8% of global production capacity, and its product exports are highly dependent on key maritime routes. This means that any escalation of regional tensions could quickly translate into price increases.
Meanwhile, other major metals showed divergent performance, with copper and zinc experiencing varying degrees of pullback, while aluminum prices bucked the trend and rose, highlighting its unique supply-side driven logic. Inventory data further confirmed the tight balance in the market, with LME registered warehouse aluminum inventories falling to 375,525 tons, the lowest level since September last year. The cash contract discount to the benchmark contract narrowed to $10/ton, a five-week low, reflecting relatively strong physical demand in the near term.
Fundamental analysis
From a fundamental perspective, the escalating conflict in the Middle East is the core driver of rising aluminum prices. Production capacity is concentrated in the region, and export routes are highly dependent on the Strait of Hormuz. Any uncertainty in this passage will directly impact the smooth operation of the global aluminum supply chain. Iran has previously stated that it will take action against ships attempting to pass through the Strait of Hormuz, exacerbating market concerns about shipping disruptions. Several global aluminum producers have suspended offering second-quarter premium quotes to Japanese buyers, further reflecting signals of tightening supply and demand in the physical market.
Inventory changes provided strong support for fundamentals. LME registered warehouse data showed that 45,325 tons of aluminum were recently cancelled at Port Klang, Malaysia, bringing total inventory down to a low of 375,525 tons. Since November last year, LME aluminum inventories have been continuously declining, while global physical premiums have remained high. A well-known investment bank pointed out in a report that this inventory reduction and rising premiums together indicate a tight supply in the physical market.
Commerzbank analysts emphasized that if the conflict fails to ease quickly, it could lead to difficulties and bottlenecks in aluminum supply, providing corresponding support for prices. While the strengthening of the US dollar index due to safe-haven demand has increased the cost of gold for non-dollar holders to some extent, aluminum, as an industrial metal, is more driven by supply-side events. Overall, fundamental factors are providing a solid floor for aluminum prices, and supply risks remain the dominant variable in the short term.
It is important to note that while aluminum consumption is influenced by the pace of global manufacturing, the market focus has now clearly shifted to supply-side disruptions. This change in supply and demand structure has resulted in aluminum futures exhibiting a relatively independent price trend within the metals sector.
Technical Analysis
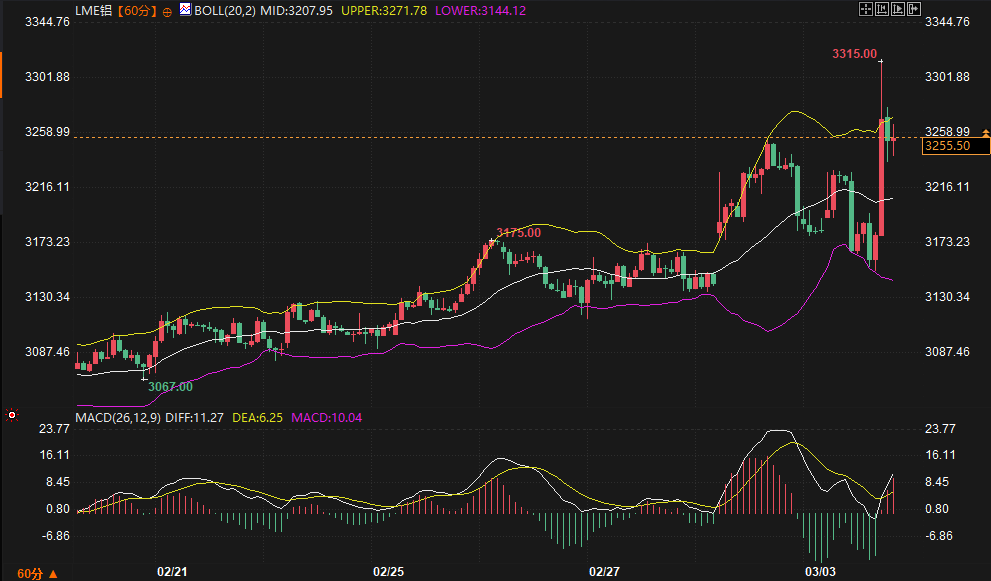
Technical and fundamental factors are converging, confirming the short-term upward momentum in aluminum prices. The 60-minute candlestick chart shows that prices started around $3067.00, gradually climbing to $3315.00, during which time they effectively broke through the upper Bollinger Band at $3271.88, before experiencing a natural pullback. This breakout confirms the strengthening of the trend.
The MACD indicator shows a clear bullish alignment, with the DIFF line at 11.31, the DEA line at 6.26, and the MACD histogram at 10.10, which continues to expand, indicating strong short-term upward momentum. The price has currently encountered resistance near $3256.00 and has retreated, entering a high-level consolidation phase. The Bollinger Bands maintain a certain width, indicating that volatility remains within a manageable range.
The aforementioned technical signals resonate with fundamental supply concerns. The tight physical balance resulting from inventory reduction is reflected in the candlestick pattern as a step-like upward movement after stabilizing at low levels, while the expanding MACD histogram further confirms the accumulation of bullish momentum. No significant divergence has emerged in the technical picture, and the overall structure still leans towards a bullish trend.
Support and resistance range prediction
Based on the current market structure, the short-term support and resistance levels can be assessed as follows: The resistance level, referencing recent highs and the upper Bollinger Band, is expected to be between $3250 and $3260 per ton. This is based on the convergence of the historical high of $3254 and the dense resistance at $3258.99. If the price approaches this range during the day, attention should be paid to potential pullback pressure from profit-taking. The support level is focused on $3210 to $3216 per ton. This is based on the key low of $3216.11 and the psychological support formed by recent inventory data. There is strong buying interest in the LME three-month benchmark contract in this area.
Key points to watch during the trading session include: changes in trading volume when the price retraces to around $3216, and the sustainability of the breakout above $3258. If the trading range narrows, volatility may further decrease; conversely, if fundamental news re-emerges, the probability of a breakout from the range will increase. The above range predictions are entirely based on a combined analysis of historical price patterns, indicator positions, and fundamental events, providing a reference framework for market analysis.
Future Trend Outlook
Looking ahead, aluminum futures are expected to maintain a slightly bullish and volatile pattern in the short term. If the Middle East conflict continues, supply-side risks will continue to support prices, the inventory reduction trend is likely to continue, and physical premiums may remain firm. Technically, bullish signals have not yet weakened, the Bollinger Bands are still expanding, and the price center of gravity is expected to gradually move upwards.
Meanwhile, the market needs to continuously monitor the dollar's trajectory, global aluminum production dynamics, and the actual passage of key maritime routes. If supply bottlenecks ease, prices may experience a temporary pullback; conversely, a tight balance will drive prices to continue testing higher levels. Overall, under the current environment, the central level of aluminum prices has risen compared to before, and volatility is expected to remain within a reasonable range.
Frequently Asked Questions
1. What are the main driving factors behind the recent rise in aluminum futures?
A: The core driver is supply concerns stemming from the conflict in the Middle East. This region accounts for 8% of global aluminum production capacity and relies on the Strait of Hormuz for exports; related tensions directly increase market risk premiums. Meanwhile, LME inventories have fallen to a low of 375,525 tons, further reinforcing expectations of a tight physical supply balance.
2. What is the practical significance of the decline in LME aluminum inventories for prices?
A: Inventory reductions have been ongoing since November of last year, accompanied by large-scale cancellations at Malaysian ports, indicating a decrease in available spot goods. A well-known investment bank points out that this, along with rising global physical commodity premiums, confirms tight supply. The narrowing of the cash contract discount to a five-week low suggests relatively strong demand in the near term, providing a floor for prices.
3. What does a bullish MACD alignment represent from a technical perspective?
A: The DIFF, DEA, and MACD histograms are all positive and expanding, indicating strong short-term upward momentum. Combined with the pullback pattern after the 60-minute candlestick chart broke through the upper Bollinger Band, this shows that bullish forces are dominant, resonating with fundamental supply risks, and no indicator divergence has been observed.
4. How are the support and resistance levels for the current aluminum price defined?
A: The key resistance level to watch is $3250-$3260/ton, based on the recent high of $3254 and the resistance at $3258.99; the support level is at $3210-$3216/ton, referencing the low of $3216.11 and the psychological level formed by inventory data. These ranges are determined by historical prices, Bollinger Band positions, and fundamental events.
5. What variables might influence the future trend of aluminum futures?
A: Key variables include the evolution of the Middle East conflict, the passage of traffic through the Strait of Hormuz, the pace of LME inventory reduction, and fluctuations in the US dollar index. If supply bottlenecks persist, the price level is expected to remain high; conversely, if geopolitical factors ease, the market may experience a pullback. The sustainability of bullish technical signals will also be an important indicator to observe.
- Risk Warning and Disclaimer
- The market involves risk, and trading may not be suitable for all investors. This article is for reference only and does not constitute personal investment advice, nor does it take into account certain users’ specific investment objectives, financial situation, or other needs. Any investment decisions made based on this information are at your own risk.