The Japanese Yen and Japanese Bonds in the Eye of the Geopolitical Storm: Energy Lifeline Under Pressure, How Long Can the 157 Mark Hold?
2026-03-04 19:57:46
Table of Contents
On Wednesday (March 4), the foreign exchange and bond markets were intertwined with uncertainties stemming from geopolitical factors. The USD/JPY exchange rate was 157.131, down 0.35% from the previous trading day. The intraday high reached 157.858 and the low dipped to 156.850, opening at 157.446, with a range of 0.64%. Despite the intraday pullback, the overall market remained shrouded in concerns about energy supplies triggered by geopolitical tensions in the Middle East. As an economy highly dependent on Middle Eastern energy, the potential impact of disrupted import channels on Japan is being transmitted through inflation expectations to policy paths, exchange rates, and bond market pricing.

Analysis of Japan's Energy Dependence in the Middle East
Approximately 95% of Japan's oil imports come from the Middle East. In January, Japan imported 2.8 million barrels per day, with 1.6 million barrels coming from Saudi Arabia, and the remainder from the UAE, Kuwait, and Qatar. Regarding liquefied natural gas (LNG), the Middle East accounts for 11% of Japan's total imports, primarily from Qatar, Oman, and the UAE, while Australia remains its largest source, accounting for about 40%.
The Middle East conflict has effectively closed the Strait of Hormuz, a passage that carries approximately 70% of Japan's oil imports and 6% of its liquefied natural gas imports. Faced with the risk of supply disruptions, Japan has established an emergency oil reserve equivalent to 254 days of consumption, divided into a national reserve of 146 days, a private sector reserve of 101 days, and a joint reserve with oil-producing countries of 7 days. Saudi Aramco's lease agreement for 13 oil storage tanks in Okinawa has been in effect since 2010, renewed every three years. Japan provides free storage space in exchange for priority extraction rights in emergency situations; this agreement remains in effect.
Liquefied natural gas (LNG) reserves have also been strengthened. As of March 1, major utility companies' inventories increased by 10% from the previous week, reaching 2.19 million tons, equivalent to approximately 12 days of consumption. Total storage exceeds 4 million tons. Considering only the weekly supply of 1,000 tons via the Strait of Hormuz, existing reserves could cover a supply disruption in the Middle East for 44 weeks; even if all LNG imports were to cease, reserves could sustain the supply for approximately three weeks. Japan trades approximately 40 million tons of LNG annually, and in an emergency, it can repatriate some of its cargo through agreements with Qatar and ongoing discussions regarding cargo swaps with Italy and South Korea. Furthermore, JERA, the largest buyer, acts as the government's agent, securing at least one shipment of approximately 70,000 tons of LNG each month to mitigate supply risks.
The Japanese government has activated a fossil fuel price subsidy mechanism to buffer the impact of rising import costs on the domestic market. Against the backdrop of a weak yen, this dependence makes Japan particularly sensitive to energy price fluctuations. A well-known market report emphasizes that despite the existence of reserve buffers, continued disruptions will still push up import costs and transmit them through the supply chain to overall price levels.
USD/JPY Technical Analysis
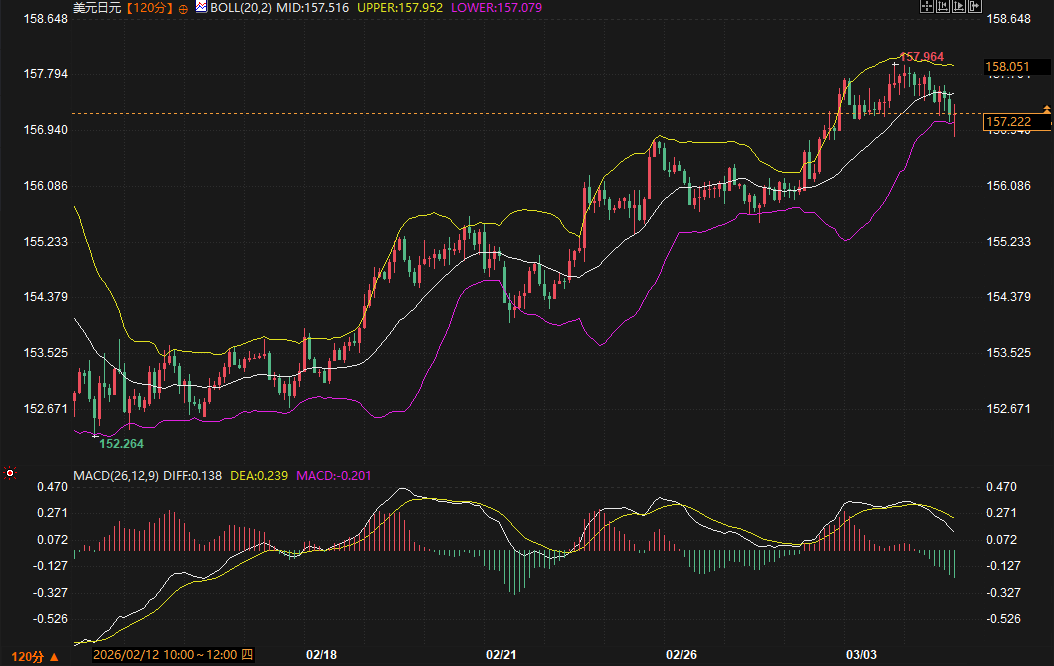
The 120-minute candlestick chart shows that the USD/JPY pair has recently experienced a significant upward trend, rising from around 152.264 to a high of 157.964, clearly breaking through the Bollinger Band's middle band at 157.512 and upper band at 157.959. The MACD indicator remains in a bullish alignment, with the DIFF value (0.133) and DEA value (0.238) both above the zero line and forming a golden cross. The MACD histogram is positive and continues to expand, indicating that momentum is still accumulating.
The current exchange rate is hovering around 157.131, close to the intraday high of 157.858, and faces downward pressure from profit-taking in the short term. However, from a longer-term perspective, this breakout has brought the price into a higher range, and a breakout of the upper Bollinger Band often signifies initial confirmation of a trend continuation. Combined with fundamentals, rising energy import costs in Japan may further boost domestic inflation expectations, thereby weakening market bets on a near-term interest rate hike by the Bank of Japan, which echoes the strong technical indicators.
Key levels to watch during the session include the 157.500-157.800 range. This area serves as both a recent pullback support level after the breakout and a confluence of the Bollinger Band middle line and previous highs. The 157.000 level represents short-term psychological support; a break below this level could lead to a test of the lows around 156.850. Overall, the technical structure remains bullish, but caution is advised regarding the potential for sudden volatility caused by escalating geopolitical events, which could temporarily disrupt the momentum.
Analysis of Changes in the Japanese Bond Yield Curve
Ahead of tomorrow's 30-year government bond auction, the Japanese government bond yield curve has steepened significantly. Driven by risk aversion in Asian stock markets, the Nikkei index fell 7.8% in the first three trading days of March, erasing all gains since the February 8 election. The South Korean KOSPI index fell more than 12% in a single day. Against this backdrop, Japanese government bond futures rose slightly in early trading, opening at 132.67, then briefly fell to 132.59, but rebounded as the stock market continued to decline, breaking through 133.00 and reaching a high of 133.07.
On the yield curve, short-term yields declined due to weakened expectations of a Bank of Japan rate hike: the 2-year yield was 1.235%, the 5-year yield was 1.58%, and the 10-year yield was 2.115%, each down about 1 basis point; the medium-term 5-year yield briefly dipped to 1.565%, with the decline widening to 2.5 basis points. Conversely, long-term yields rose, with the 40-year yield closing at 3.58%, up 3.5 basis points from the previous day, and the 30-year yield rising 2.5 basis points to 3.355%. The steepening of the yield curve is mainly due to concerns about oil price inflation triggered by the Middle East conflict: short-term pricing reflects a delayed expectation of policy tightening, while long-term pricing accounts for the risk that future inflationary pressures may cause central bank policy to lag behind.
The Bank of Japan's bond-buying operations were weak on the day, particularly with insufficient demand for 10-25 year maturities, further exacerbating selling pressure at the ultra-long end. A well-known institution's analysis points out that this type of yield curve shape is typical under the dual drivers of risk aversion and inflation. Japan's highly energy-dependent structure amplifies the upward effect of oil price shocks on long-term yields, while the short end is supported by uncertainty surrounding the policy path.
Future Trend Outlook
In the short term, if the geopolitical tensions in the Middle East remain unchanged, Japan's energy reserves can temporarily mitigate supply shocks. However, a prolonged period of tension will gradually increase import costs and strengthen inflation expectations. The Bank of Japan's interest rate hike path faces greater uncertainty, and the market may further postpone pricing in policy tightening. This will support the yen's weakness and keep the government bond yield curve steep. The USD/JPY pair still has technical support above 157.000, and the upper Bollinger Band expansion may continue, but attention should be paid to the accumulating resistance in the 157.800-158.000 area.
In the Japanese bond market, the 30-year auction results will be a key point of observation. Risk aversion tends to suppress overall yields, while oil price-driven inflation concerns may limit the downside for longer-term yields, and the steepening of the yield curve may continue in the coming trading days. The focus will be on energy inventory data updates and changes in geopolitical news. If inventories continue to replenish slightly, it may alleviate short-term inflation anxieties; conversely, if developments related to the Hormuz deteriorate, upward pressure on long-term yields will reappear.
Overall, the convergence of fundamentals and technical factors points to the following: cost pressures from energy dependence are influencing exchange rates and bond market pricing through policy expectations. The market will continue to assess the actual transmission strength of disruption risks, rather than a single event-driven shock.
Frequently Asked Questions
Question 1: What data specifically demonstrates Japan's dependence on Middle Eastern oil?
Answer: Japan imports 95% of its oil from the Middle East. Of the 2.8 million barrels per day imported daily in January, 1.6 million barrels came from Saudi Arabia, with the remainder from countries such as the UAE. The Strait of Hormuz handles 70% of Japan's oil imports; its closure would directly impact supply stability. However, Japan has reserves sufficient for 254 days of consumption, with Saudi Arabia's storage tanks in Okinawa providing additional buffer. These data indicate that while the dependence structure is high, the reserve system incorporates multi-layered contingency mechanisms.
Question 2: How will the disruption of energy supplies from the Middle East affect Japan's inflation and monetary policy expectations?
Answer: Rising import costs will directly push up domestic fossil fuel prices, and the Japanese government has already implemented subsidies to alleviate the burden on residents. This pressure is even more pronounced in a weak yen environment. As a result, the market has lowered its expectations for a near-term interest rate hike by the Bank of Japan, leading to a decline in short-term government bond yields, while long-term yields have steepened due to persistent inflation risks. Energy dependence has become a key link connecting geopolitical events and policy paths.
Question 3: How to interpret the MACD and Bollinger Band signals on the 120-minute chart of USD/JPY?
Answer: The price broke through the upper Bollinger Band and stabilized above the middle band. The MACD golden cross and the expanding histogram further confirm bullish momentum. The current price is close to recent highs, and a short-term pullback is possible, but the overall structure still supports an upward shift in the trading range. This technical movement is in line with expectations of a weaker yen due to energy inflation, rather than being an isolated price action.
Question 4: What does a steepening of the Japanese bond yield curve mean for the market?
Answer: The decline in short-term yields reflects a postponement of interest rate hike expectations, while the rise in long-term yields reflects heightened inflation concerns. This pattern typically occurs during periods of coexisting geopolitical risks and energy price volatility. As a major energy importer, Japan's dependence amplifies the impact of oil prices on long-term pricing. Tomorrow's 30-year yield auction will be a direct window into market risk appetite and inflation expectations.
Question 5: How does Japan mitigate energy risks through reserves and agreements?
Answer: Oil reserves cover 254 days, and liquefied natural gas (LNG) inventories have increased to 2.19 million tons, sufficient to cover several weeks of demand in the event of a disruption. JERA locks in one shipment per month, and the Qatar Agreement and potential cargo swap arrangements provide additional flexibility. The experience of coordinated releases during the 2022 Russia-Ukraine conflict also demonstrates that Japan prefers to act in conjunction with multilateral mechanisms such as the International Energy Agency, rather than using its reserves unilaterally. These arrangements collectively form a buffer system, reducing the impact of a single disruption.
- Risk Warning and Disclaimer
- The market involves risk, and trading may not be suitable for all investors. This article is for reference only and does not constitute personal investment advice, nor does it take into account certain users’ specific investment objectives, financial situation, or other needs. Any investment decisions made based on this information are at your own risk.