Tensions rise in the Middle East, while US Treasury bonds and the dollar face conflicting priorities? Gold prices have plunged into a "sandwich" situation; will it break out tonight?
2026-03-05 20:43:02
On Thursday (March 5), global financial markets exhibited highly volatile patterns amid escalating tensions in the Middle East and a rebound in energy prices. The 10-year US Treasury yield remained around 4.120%, continuing its recent V-shaped reversal; the US dollar index hovered around 98.9877, showing clear signs of high-level consolidation; spot gold rose slightly from $5165.95 per ounce, attempting to find balance in the recovery phase following the previous day's sharp decline. The short-term performance of these assets is heavily influenced by the transmission of geopolitical risks to the bond market, coupled with adjustments in Federal Reserve policy expectations, leading to a more cautious overall market risk appetite. Energy prices hit a new high of $76.61, further amplifying inflation concerns and pushing bond yields upward, which in turn strengthens the dollar's attractiveness as a safe-haven asset, while simultaneously exerting opportunity cost pressure on gold. The following analysis will begin with US Treasury yields, exploring their transmission mechanism to the dollar, and focusing on how bond market volatility triggers a safe-haven effect on gold, combining technical indicators and fundamental factors to forecast the trend over the next 2-3 days.

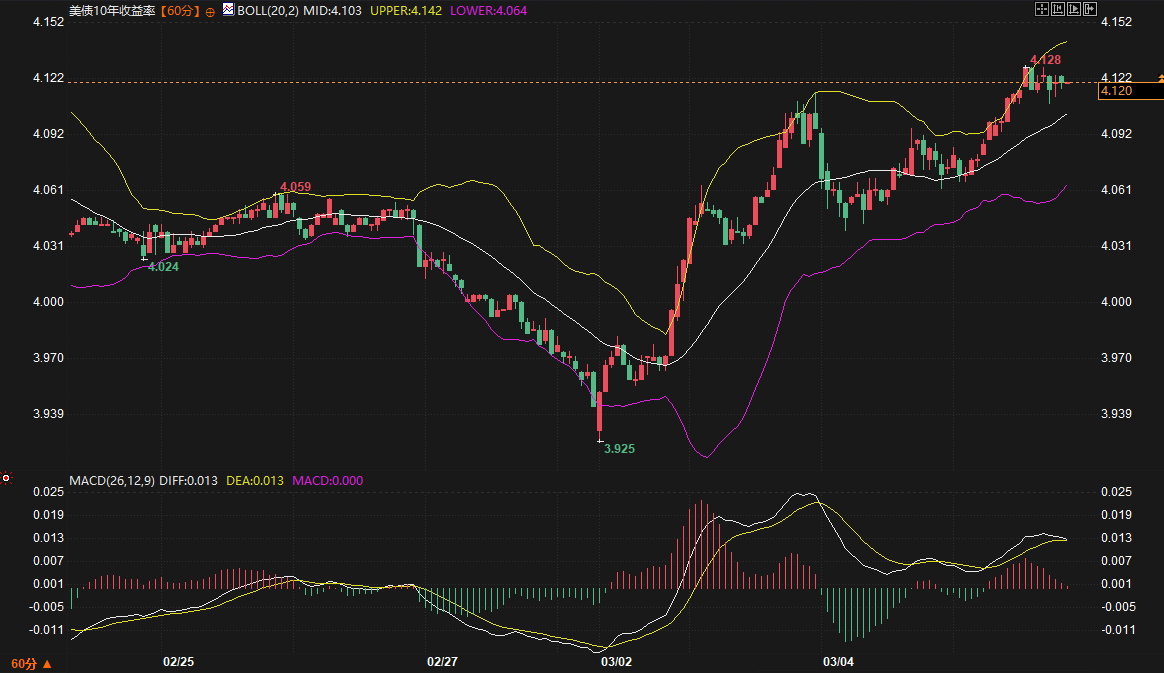
After significant recent volatility, the 10-year US Treasury yield is currently quoted at 4.120%, close to its recent high of 4.128%. From February 27 to March 2, the yield fell rapidly from 4.059% to a low of 3.925%, before staging a V-shaped reversal, strongly breaking through the previous consolidation range high. This reversal reflects the rapid cooling of market expectations for a Fed rate cut: the initial decline stemmed from investor concerns about an economic slowdown, but a subsequent rebound in energy prices and escalating tensions in the Middle East fueled inflation expectations, increasing selling pressure on US Treasuries and causing yields to rise. Fundamentally, energy prices rebounded from last week's high of $79.46 to a new high of $78.09, directly amplifying bond market volatility. Overnight, US Treasuries weakened further with increased trading volume, indicating that while awaiting new developments in the Middle East situation, the market is also becoming more sensitive to rising inflation.
Technical indicators further confirm this strong pattern. The Bollinger Bands show the price closely following the upper band, with the middle band at 4.103% providing short-term support. The bands are widening upwards, indicating a solid bullish trend. However, the MACD indicator shows both the DIFF and DEA at the 0.013 level, the red bars nearing zero, and the fast and slow lines converging, suggesting signs of weakening upward momentum in the short term. This means that if yields cannot effectively break through the 4.13% level, they may face the risk of stagnation. From the perspective of the transmission of the bond market to the US dollar, rising US Treasury yields directly increase the relative attractiveness of dollar assets: higher real yields mean an increased opportunity cost of holding non-interest-bearing assets, but at the same time strengthen the dollar's status as the global reserve currency. Recent data shows that the dollar index rose from a low of 97.4880 to a high of 99.6887 during the rise in US Treasury yields, showing a strong positive correlation. This linkage stems from the fact that when bond yields rise, investors tend to flow back into dollar assets to hedge against global risk exposure. Fundamental support includes the Federal Reserve's Beige Book report showing modest economic growth, continued price increases, and stable employment, further reducing the probability of a rate cut. The CME FedWatch tool indicates that the prevailing expectation is for the March 18 meeting to maintain the current interest rate. Meanwhile, the weekly jobless claims data to be released on Thursday and the February jobs report on Friday will be key catalysts for bond yield volatility. Stronger-than-expected data will amplify upward pressure on yields, thereby supporting the dollar's resilience within the 98.7-99.2 range.
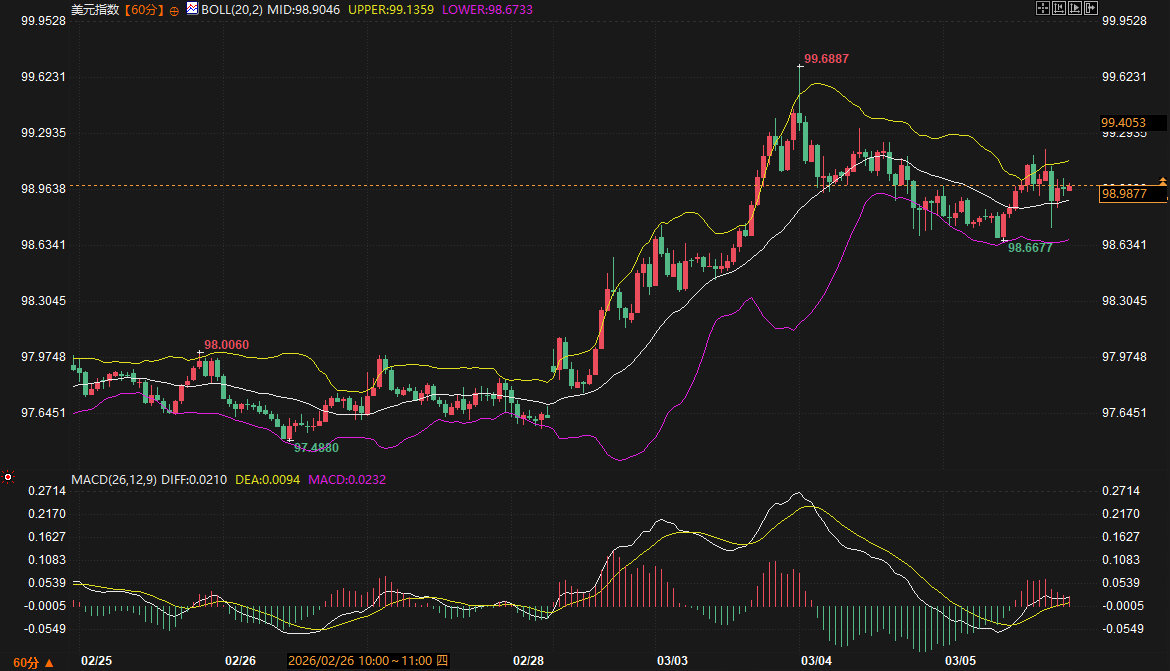
Unlike conventional analysis, this article emphasizes bond yields as the core driver of dollar fluctuations, rather than solely relying on exchange rate volatility or trade factors. For example, concerns about energy supply stemming from the Middle East situation directly fueled bond selling, leading to higher yields. This, in turn, reinforced the dollar's safe-haven status, rather than viewing the dollar as an independent variable. The dollar index is currently quoted at 98.9877, trading near the Bollinger Band middle line at 98.9046. The upper band at 99.1359 provides resistance, while the lower band at 98.6733 offers support. The flattening Bollinger Bands indicate a consolidation pattern. The MACD histogram is slightly expanding, and the fast and slow lines have formed a golden cross at a low level and are trending slightly upwards, suggesting a weak short-term rebound. Looking at the unilateral upward trend that began on February 28th, the dollar rapidly rose from around 97.6 to a high of 99.68, before pulling back and entering a high-level consolidation phase, with the price still above the starting platform. This closely matches the synchronized rise in US Treasury yields: during periods of rising yields, the dollar benefits from capital inflows, while when yield momentum weakens, the dollar may enter a period of range-bound consolidation. In the next 2-3 days, pay attention to the effectiveness of the support at the 4.103% midline of the bond market yield. If it holds steady, the US dollar index is expected to test the 99 level; conversely, if the yield falls, the downside risk for the US dollar points to the 98.6733 support level.
Spot gold, amid rising bond yields, exhibits a typical balancing act between safe-haven demand and opportunity cost. Currently priced at $5165.95/oz, with a recent high of $5419.01/oz and a recent low of $4996.33/oz. From February 28th to March 3rd, gold surged from around $5150 to a record high of $5419, breaking its usual negative correlation with the US dollar and US Treasury bonds. This surge was primarily driven by safe-haven demand fueled by escalating tensions in the Middle East. Israel's attacks on Iranian infrastructure led millions to seek asylum, amplifying global uncertainty and benefiting gold as a traditional safe-haven asset. Despite a strengthening US dollar, gold's gains exceeded expectations due to geopolitical risks. However, March 4th saw an extreme single-day drop of over $400, with prices falling back to the previous consolidation range, reflecting the suppressive effect of the bond market transmission after the short-term surge in safe-haven sentiment.
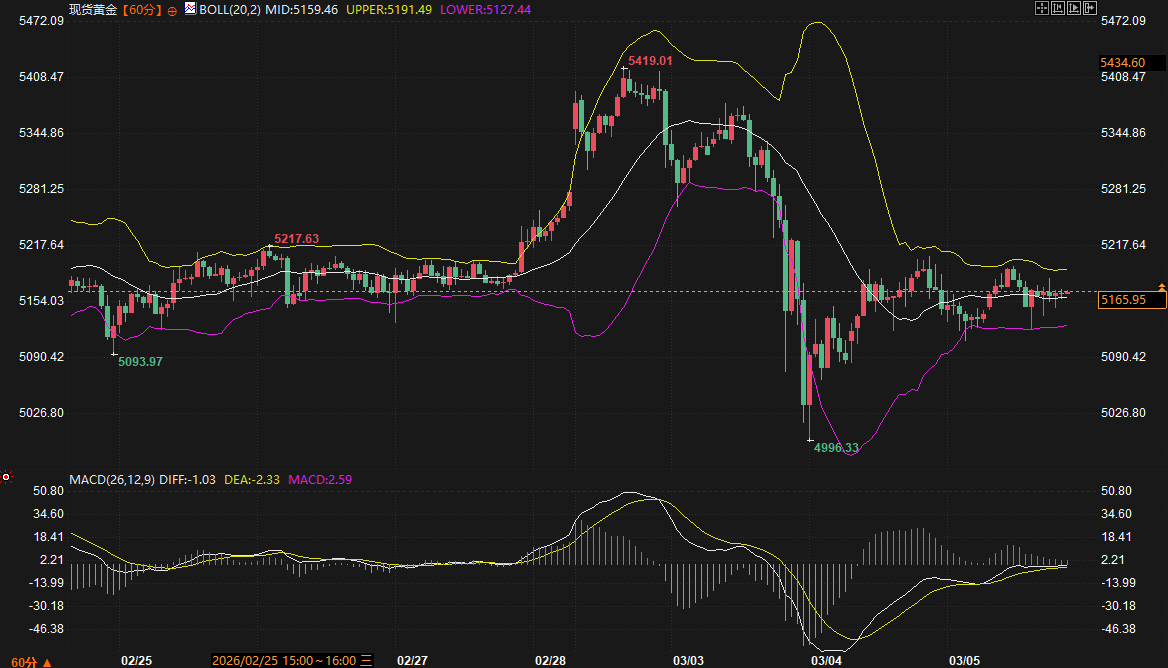
From a fundamental perspective, the escalating situation in the Middle East, including Iran's warnings to Washington and the sinking of a warship, has further pushed up energy prices and triggered inflation concerns. This has a dual impact on gold: on the one hand, long-term inflation expectations are beneficial for gold as a hedging tool; on the other hand, rising bond yields directly increase the opportunity cost of holding gold, especially when the Fed's interest rate cut path is blocked. Analysts from well-known institutions point out that, on the one hand, the Middle East conflict may enhance the safe-haven demand for gold; on the other hand, high energy prices, if leading to sustained high interest rates, will limit gold's gains. On Thursday, gold rose slightly by 0.4% to $5156.11 per ounce, and April futures rose 0.7% to $5168.20 per ounce, partly due to safe-haven buying, but the dollar's rebound to around 99.00 limited further gains. Technically, the Bollinger Bands show that the price is fluctuating around the middle band at $5159.46, with the upper band at $5191.49 acting as short-term resistance and the lower band at $5127.44 acting as support, with the band narrowing and entering a consolidation phase. The MACD red bars continue to shorten, indicating weakening rebound momentum. The upward slope of the fast and slow lines has slowed down after the golden cross at a low level, suggesting a recovery and consolidation phase.
The difference between this analysis and others lies in its focus on the safe-haven effect transmitted through the bond market, rather than a general discussion of the negative correlation between gold and the US dollar. When bond yields rise, rising real interest rates suppress gold, but if the situation in the Middle East triggers broader safe-haven demand, bond market volatility may indirectly amplify gold demand. For example, during the rise in US Treasury yields from 3.925%, gold surged against the trend, but subsequently returned to a negative correlation, with the subsequent consolidation reflecting the transmission of pressure from the bond market. In the short term, attention should be paid to the lower Bollinger Band support at $5127. If bond yields continue to rise, the risk of further declines in gold increases; conversely, if yields stagnate, a gold rebound could target the $5200 level. Intraday focus includes energy price dynamics; if oil prices break through $78, increased selling pressure in the bond market will strengthen the downward pressure on gold. Simultaneously, if weekly unemployment data shows resilience in employment, adjustments to the Fed's policy expectations will further impact the bond-gold transmission chain.
Over the past 10 trading days, the price movements of these three assets have perfectly followed the classic negative correlation logic of major asset classes. However, by incorporating the perspective of bond market transmission, a more detailed and differentiated interpretation can be provided. During the period of simultaneous movement (February 28th - March 3rd), US Treasury yields rebounded rapidly from 3.925%, and the US dollar rose in tandem. This strong positive correlation reflected a cooling of expectations for a Fed rate cut. Gold's surge against the market trend stemmed from an independent safe-haven rally driven by the Middle East situation, breaking the conventional relationship. In the period of returning to negative correlation (March 4th to present), US Treasury yields continued to rise, the US dollar fluctuated at high levels, and gold consolidated after a sharp drop. The logic of the three has returned to normal: rising yields increase the opportunity cost of gold, and a stronger dollar further suppresses it. Currently, we are in a phase of equilibrium. The upward momentum of US Treasury yields is weakening, the US dollar is fluctuating, gold has found support, the negative correlation is weakening, and we are entering a window for directional selection.
From a fundamental and technical perspective, the Middle East situation and the uncertainties surrounding the US-Israel-Iran conflict (such as elections, survival, and the dismantling of regime accounts), coupled with a rebound in energy prices, are driving bond market volatility. The US dollar benefits from safe-haven inflows, but if bond yields weaken, their upside will be limited. Gold's safe-haven effect depends on the release of pressure in the bond market; if yields fall, there is room for recovery. Support and resistance levels are predicted as follows: For the 10-year US Treasury yield, referencing the June contract, support is at 4.103% (Bollinger middle band, based on a pullback after momentum exhaustion), and resistance is at 4.13% (a breakout point from the previous high, driven by energy prices). The US dollar index has support at 98.6733 (Bollinger lower band, the lower limit of high-level consolidation) and resistance at 99.1359 (Bollinger upper band, dependent on bond market support). Spot gold has support at $5127 (Bollinger lower band, the lower limit of a sharp drop correction) and resistance at $5191 (Bollinger upper band, based on a safe-haven rebound). Pay close attention to the immediate impact of energy prices and unemployment data on the bond market during trading hours, and avoid interpreting technical indicators in isolation from fundamentals.
Over the next 2-3 days, the price movements of these three asset classes will be highly dependent on the direction of bond yields. If yields break through 4.13%, the US dollar index may face pressure at the 99 level, but will generally remain within the 98.7-99.2 range. Gold is more likely to test the $5127 support level, as its safe-haven effect is suppressed by opportunity costs. If yields stagnate and fall, the dollar will weaken and consolidate, leading to a recovery in gold with a target of $5200. The negative correlation between US Treasuries, the dollar, and gold will further weaken. Overall, the market is entering a period of equilibrium, with price fluctuations mainly characterized by range-bound movements. Attention should be paid to the impact of developments in the Middle East and employment data on the bond market.
Frequently Asked Questions
Dynamics of US Treasury Yields and the Dollar Transmission Mechanism
After significant recent volatility, the 10-year US Treasury yield is currently quoted at 4.120%, close to its recent high of 4.128%. From February 27 to March 2, the yield fell rapidly from 4.059% to a low of 3.925%, before staging a V-shaped reversal, strongly breaking through the previous consolidation range high. This reversal reflects the rapid cooling of market expectations for a Fed rate cut: the initial decline stemmed from investor concerns about an economic slowdown, but a subsequent rebound in energy prices and escalating tensions in the Middle East fueled inflation expectations, increasing selling pressure on US Treasuries and causing yields to rise. Fundamentally, energy prices rebounded from last week's high of $79.46 to a new high of $78.09, directly amplifying bond market volatility. Overnight, US Treasuries weakened further with increased trading volume, indicating that while awaiting new developments in the Middle East situation, the market is also becoming more sensitive to rising inflation.
Technical indicators further confirm this strong pattern. The Bollinger Bands show the price closely following the upper band, with the middle band at 4.103% providing short-term support. The bands are widening upwards, indicating a solid bullish trend. However, the MACD indicator shows both the DIFF and DEA at the 0.013 level, the red bars nearing zero, and the fast and slow lines converging, suggesting signs of weakening upward momentum in the short term. This means that if yields cannot effectively break through the 4.13% level, they may face the risk of stagnation. From the perspective of the transmission of the bond market to the US dollar, rising US Treasury yields directly increase the relative attractiveness of dollar assets: higher real yields mean an increased opportunity cost of holding non-interest-bearing assets, but at the same time strengthen the dollar's status as the global reserve currency. Recent data shows that the dollar index rose from a low of 97.4880 to a high of 99.6887 during the rise in US Treasury yields, showing a strong positive correlation. This linkage stems from the fact that when bond yields rise, investors tend to flow back into dollar assets to hedge against global risk exposure. Fundamental support includes the Federal Reserve's Beige Book report showing modest economic growth, continued price increases, and stable employment, further reducing the probability of a rate cut. The CME FedWatch tool indicates that the prevailing expectation is for the March 18 meeting to maintain the current interest rate. Meanwhile, the weekly jobless claims data to be released on Thursday and the February jobs report on Friday will be key catalysts for bond yield volatility. Stronger-than-expected data will amplify upward pressure on yields, thereby supporting the dollar's resilience within the 98.7-99.2 range.
Unlike conventional analysis, this article emphasizes bond yields as the core driver of dollar fluctuations, rather than solely relying on exchange rate volatility or trade factors. For example, concerns about energy supply stemming from the Middle East situation directly fueled bond selling, leading to higher yields. This, in turn, reinforced the dollar's safe-haven status, rather than viewing the dollar as an independent variable. The dollar index is currently quoted at 98.9877, trading near the Bollinger Band middle line at 98.9046. The upper band at 99.1359 provides resistance, while the lower band at 98.6733 offers support. The flattening Bollinger Bands indicate a consolidation pattern. The MACD histogram is slightly expanding, and the fast and slow lines have formed a golden cross at a low level and are trending slightly upwards, suggesting a weak short-term rebound. Looking at the unilateral upward trend that began on February 28th, the dollar rapidly rose from around 97.6 to a high of 99.68, before pulling back and entering a high-level consolidation phase, with the price still above the starting platform. This closely matches the synchronized rise in US Treasury yields: during periods of rising yields, the dollar benefits from capital inflows, while when yield momentum weakens, the dollar may enter a period of range-bound consolidation. In the next 2-3 days, pay attention to the effectiveness of the support at the 4.103% midline of the bond market yield. If it holds steady, the US dollar index is expected to test the 99 level; conversely, if the yield falls, the downside risk for the US dollar points to the 98.6733 support level.
Analysis of the transmission of bond market volatility to the safe-haven effect of gold
Spot gold, amid rising bond yields, exhibits a typical balancing act between safe-haven demand and opportunity cost. Currently priced at $5165.95/oz, with a recent high of $5419.01/oz and a recent low of $4996.33/oz. From February 28th to March 3rd, gold surged from around $5150 to a record high of $5419, breaking its usual negative correlation with the US dollar and US Treasury bonds. This surge was primarily driven by safe-haven demand fueled by escalating tensions in the Middle East. Israel's attacks on Iranian infrastructure led millions to seek asylum, amplifying global uncertainty and benefiting gold as a traditional safe-haven asset. Despite a strengthening US dollar, gold's gains exceeded expectations due to geopolitical risks. However, March 4th saw an extreme single-day drop of over $400, with prices falling back to the previous consolidation range, reflecting the suppressive effect of the bond market transmission after the short-term surge in safe-haven sentiment.
From a fundamental perspective, the escalating situation in the Middle East, including Iran's warnings to Washington and the sinking of a warship, has further pushed up energy prices and triggered inflation concerns. This has a dual impact on gold: on the one hand, long-term inflation expectations are beneficial for gold as a hedging tool; on the other hand, rising bond yields directly increase the opportunity cost of holding gold, especially when the Fed's interest rate cut path is blocked. Analysts from well-known institutions point out that, on the one hand, the Middle East conflict may enhance the safe-haven demand for gold; on the other hand, high energy prices, if leading to sustained high interest rates, will limit gold's gains. On Thursday, gold rose slightly by 0.4% to $5156.11 per ounce, and April futures rose 0.7% to $5168.20 per ounce, partly due to safe-haven buying, but the dollar's rebound to around 99.00 limited further gains. Technically, the Bollinger Bands show that the price is fluctuating around the middle band at $5159.46, with the upper band at $5191.49 acting as short-term resistance and the lower band at $5127.44 acting as support, with the band narrowing and entering a consolidation phase. The MACD red bars continue to shorten, indicating weakening rebound momentum. The upward slope of the fast and slow lines has slowed down after the golden cross at a low level, suggesting a recovery and consolidation phase.
The difference between this analysis and others lies in its focus on the safe-haven effect transmitted through the bond market, rather than a general discussion of the negative correlation between gold and the US dollar. When bond yields rise, rising real interest rates suppress gold, but if the situation in the Middle East triggers broader safe-haven demand, bond market volatility may indirectly amplify gold demand. For example, during the rise in US Treasury yields from 3.925%, gold surged against the trend, but subsequently returned to a negative correlation, with the subsequent consolidation reflecting the transmission of pressure from the bond market. In the short term, attention should be paid to the lower Bollinger Band support at $5127. If bond yields continue to rise, the risk of further declines in gold increases; conversely, if yields stagnate, a gold rebound could target the $5200 level. Intraday focus includes energy price dynamics; if oil prices break through $78, increased selling pressure in the bond market will strengthen the downward pressure on gold. Simultaneously, if weekly unemployment data shows resilience in employment, adjustments to the Fed's policy expectations will further impact the bond-gold transmission chain.
Cross-correlation of three commodities and short-term equilibrium
Over the past 10 trading days, the price movements of these three assets have perfectly followed the classic negative correlation logic of major asset classes. However, by incorporating the perspective of bond market transmission, a more detailed and differentiated interpretation can be provided. During the period of simultaneous movement (February 28th - March 3rd), US Treasury yields rebounded rapidly from 3.925%, and the US dollar rose in tandem. This strong positive correlation reflected a cooling of expectations for a Fed rate cut. Gold's surge against the market trend stemmed from an independent safe-haven rally driven by the Middle East situation, breaking the conventional relationship. In the period of returning to negative correlation (March 4th to present), US Treasury yields continued to rise, the US dollar fluctuated at high levels, and gold consolidated after a sharp drop. The logic of the three has returned to normal: rising yields increase the opportunity cost of gold, and a stronger dollar further suppresses it. Currently, we are in a phase of equilibrium. The upward momentum of US Treasury yields is weakening, the US dollar is fluctuating, gold has found support, the negative correlation is weakening, and we are entering a window for directional selection.
From a fundamental and technical perspective, the Middle East situation and the uncertainties surrounding the US-Israel-Iran conflict (such as elections, survival, and the dismantling of regime accounts), coupled with a rebound in energy prices, are driving bond market volatility. The US dollar benefits from safe-haven inflows, but if bond yields weaken, their upside will be limited. Gold's safe-haven effect depends on the release of pressure in the bond market; if yields fall, there is room for recovery. Support and resistance levels are predicted as follows: For the 10-year US Treasury yield, referencing the June contract, support is at 4.103% (Bollinger middle band, based on a pullback after momentum exhaustion), and resistance is at 4.13% (a breakout point from the previous high, driven by energy prices). The US dollar index has support at 98.6733 (Bollinger lower band, the lower limit of high-level consolidation) and resistance at 99.1359 (Bollinger upper band, dependent on bond market support). Spot gold has support at $5127 (Bollinger lower band, the lower limit of a sharp drop correction) and resistance at $5191 (Bollinger upper band, based on a safe-haven rebound). Pay close attention to the immediate impact of energy prices and unemployment data on the bond market during trading hours, and avoid interpreting technical indicators in isolation from fundamentals.
Future Trend Outlook
Over the next 2-3 days, the price movements of these three asset classes will be highly dependent on the direction of bond yields. If yields break through 4.13%, the US dollar index may face pressure at the 99 level, but will generally remain within the 98.7-99.2 range. Gold is more likely to test the $5127 support level, as its safe-haven effect is suppressed by opportunity costs. If yields stagnate and fall, the dollar will weaken and consolidate, leading to a recovery in gold with a target of $5200. The negative correlation between US Treasuries, the dollar, and gold will further weaken. Overall, the market is entering a period of equilibrium, with price fluctuations mainly characterized by range-bound movements. Attention should be paid to the impact of developments in the Middle East and employment data on the bond market.
Frequently Asked Questions
Question 1: How does the situation in the Middle East affect US Treasury yields and the safe-haven effect of gold?
Answer: The escalating tensions in the Middle East directly fueled a rebound in energy prices, amplifying inflation expectations and leading to increased selling pressure on US Treasuries, pushing yields higher. When bond market volatility is transmitted to gold, it strengthens safe-haven demand, pushing prices up slightly; on the other hand, it increases opportunity costs, limiting gains. In the short term, this dual effect keeps gold in a consolidation phase, and its future direction depends on whether the boundaries of the situation become clear.
Question 2: What is the logic behind the high-level fluctuation of the US dollar index, and what is its relationship with US Treasury bonds?
Answer: The US dollar index rose from 97.6 to 99.68 before entering a period of consolidation, primarily driven by safe-haven inflows, but supported by rising US Treasury yields: higher yields increase the attractiveness of dollar assets, creating a positive correlation. If yield momentum weakens, the dollar may fall back to the 98.6733 support level. Fundamental factors include adjustments in Federal Reserve policy expectations, and employment data will reinforce this transmission.
Question 3: What is the technical basis for the recovery and consolidation after the sharp drop in gold prices?
Answer: After the sharp drop, gold is fluctuating around the middle Bollinger Band at $5159. The Bollinger Bands are narrowing, and the shortening MACD histogram indicates weakening momentum. This reflects the pressure from the bond market following the safe-haven surge: rising yields are exerting downward pressure, but if prices fall back, the effectiveness of the $5127 support level will determine the extent of any rebound. Intraday focus should be on the impact of energy market dynamics on this balance.
Question 4: What changes have occurred recently in the negative correlation between the three varieties?
Answer: Initially, gold surged against the market trend, breaking the negative correlation, driven by safe-haven demand from the Middle East. Subsequently, it reverted to classic logic: rising US Treasury yields pressured gold and supported the US dollar. Currently, it has entered equilibrium, with the negative correlation weakening. Its direction in the next 2-3 days will depend on whether bond yields stagnate.
Question 5: What are the bases for predicting short-term support and resistance zones?
Answer: Based on 60-minute technical indicators, such as Bollinger Bands and MACD momentum. US Treasury bonds have support at 4.103% (based on the middle band logic), with resistance at 4.13% (a breakout point). The US dollar has support at 98.6733 (based on the lower band logic). Gold has support at $5127 (lower band logic), with resistance at $5191 (upper band logic). These ranges are integrated with fundamental factors, such as energy and employment data, to avoid detaching from market reality.
- Risk Warning and Disclaimer
- The market involves risk, and trading may not be suitable for all investors. This article is for reference only and does not constitute personal investment advice, nor does it take into account certain users’ specific investment objectives, financial situation, or other needs. Any investment decisions made based on this information are at your own risk.