The sharp decline in gold and silver prices makes it difficult to explain using traditional macroeconomic logic.
2026-03-06 19:46:48
On Thursday (March 6, 2026), gold and silver prices experienced a sharp reversal, plunging significantly. This wave of selling pressure came suddenly and swiftly, erasing some of the previous gains in just a few trading days.

However, common macroeconomic explanations—such as the rapid rise in US Treasury yields and the simultaneous strengthening of the US dollar index—appear rather far-fetched and are hardly convincing. Correlation analysis shows that the correlation between precious metal prices and US Treasury yields and the US dollar index has weakened significantly over the past week, and even lacks a clear correlation with energy futures (such as crude oil) and the market volatility index (VIX). This inevitably raises suspicions that there may be other, more direct forces driving the market.
Profit taking and position adjustment: A simpler explanation
Instead of getting bogged down in grand narratives, let's return to the simplest logic: taking profits. Despite a large-scale liquidation at the end of January, many traders and institutional investors still hold substantial unrealized gains. Gold recently approached or broke through the $5200 mark, while silver fluctuated wildly in the $80-90 range; these gains have provided substantial returns for those holding positions.
When other assets (such as stocks or risky commodities) experience a synchronized correction or loss, it is perfectly normal to reduce holdings of gold and silver to raise funds, replenish margin, or reallocate positions. Such behavior often erupts at high levels, forming a waterfall-like decline rather than a gradual adjustment.
More notably, precious metals have recently deviated significantly from their traditional role as safe-haven assets, exhibiting volatility characteristics closer to high-beta risk assets—sometimes even exceeding Bitcoin's intraday swings. They no longer simply follow risk aversion but are increasingly driven by speculative capital, leveraged trading, and short-term sentiment. This also explains why the influence of macroeconomic data (such as employment and inflation expectations) has weakened in the short term.
Technical analysis dominates short-term trading logic
In shorter timeframes (such as the 4-hour chart), a striking feature is that traders are increasingly relying on charts and technical levels for their operations, rather than blindly chasing news or macroeconomic narratives. Prices repeatedly oscillate within previously key ranges, and despite daily conflicting news (such as geopolitical tensions and expectations regarding Federal Reserve policy), these clear technical support/resistance levels at least provide a quantifiable reference framework for both bulls and bears, preventing completely chaotic trading.
Silver: Bears temporarily have the upper hand.
Silver prices have been trending lower on the 4-hour chart recently, with each new high being lower than the previous one, indicating significant downward pressure. Momentum indicators further confirm this assessment: the 14-period RSI continues to hover below 50 and shows a downward trend; the MACD line has crossed below the signal line and remains in negative territory.
This doesn't mean the bears have completely taken control of the market, but the current selling pressure is quite clear. Strategically, selling on rallies is more suitable. Unless the price effectively stabilizes above $86, the short-term bearish bias is unlikely to reverse. Earlier this week, silver encountered resistance near $86, subsequently forming a clear reversal candlestick pattern and initiating a series of declines. If it can return above $86, the short-term downtrend structure will be broken, and the trend may reverse.
Key points for reference:
Support levels: Significant buying interest has recently emerged around $80; $79.30 is more crucial – it was effectively broken at the end of February and has been tested multiple times this month, with brief dips followed by quick recoverys. If it retests this level, the previous low of $78 should be watched closely; further down, $76.30 is a secondary support level, and then the area around the February 18 low of $72 should be monitored.
Resistance levels: $86 remains a strong resistance level that has seen multiple shifts between bullish and bearish trends this year. A successful break above this level would dismantle the short-term bearish structure and could lead to a rebound to the next support level of $91.30–$92.20.
Gold: Bears find support around $5200
Gold's price action mirrored silver's. On the 4-hour chart, after touching $5200 at the beginning of the week, it encountered heavy selling pressure and fell significantly. Similarly, the 14-period RSI is below 50, and the MACD line has crossed below the signal line and is in negative territory, temporarily establishing a short-term bearish advantage.
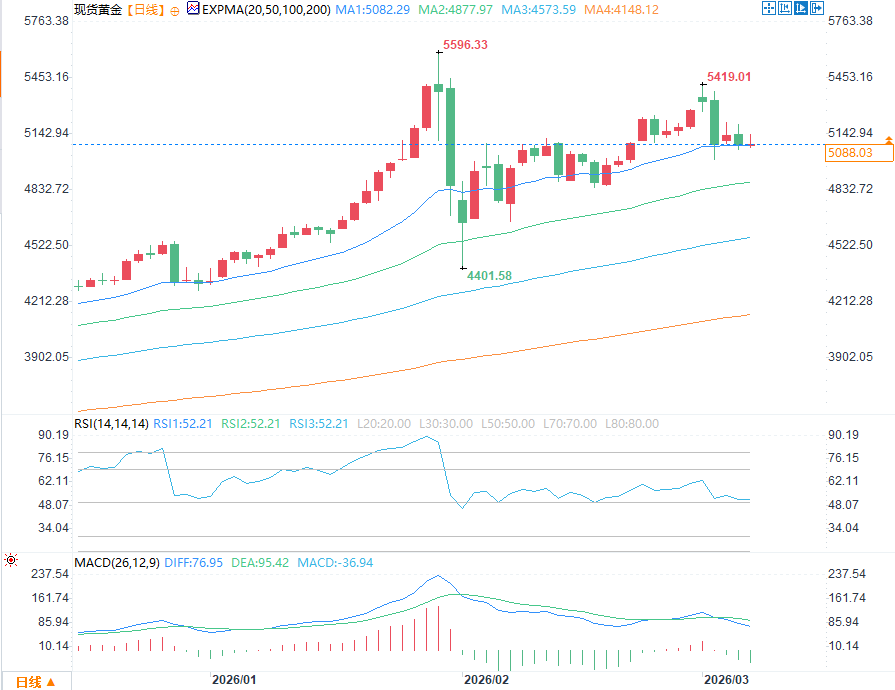
(Spot gold daily chart source: FX678)
Key points for reference:
Resistance levels: Besides $5120 (which received buying support before Thursday's sharp drop), $5200 remains a key resistance level. If $5120 is tested again on Friday and encounters resistance, it's suitable for short-term shorting, with a stop-loss order placed above that level. If it can hold above $5200, the directional risk will shift to the bulls, potentially leading to a retest of the late January high of $5420.
Support levels below: $5,000 – where the price found support on Tuesday; $4,965 – which has acted as both support and resistance multiple times in the past; $4,850 – a break below this swing low could trigger a larger pullback.
Non-farm payroll data: A crucial test of macroeconomic narratives
The US non-farm payroll report (February data) to be released tonight is likely to trigger a new round of sharp market fluctuations, bringing significant trading opportunities for gold and silver.
The mainstream macroeconomic logic has consistently held that:
Weak data → weakening US dollar and US Treasury yields → positive for gold and silver;
Strong data → Rising US dollar and yields → Negative for gold and silver.
However, reality is often far more complex than models. Strong economic data earlier this week supported US stocks, but if the non-farm payrolls report is again unexpectedly strong, it could trigger a general weakening of risk assets (stock market correction, decreased risk appetite), thus putting precious metals to the test of their "true nature"—are they still safe havens, or have they partially become amplifiers of risk assets?
In fact, while non-farm payrolls have historically been a major driver of economic activity, traders are likely to focus more on breaking geopolitical news than on a relatively lagging labor market report before the weekend. Any new developments in geopolitical risks could instantly ignite risk aversion, overshadowing the short-term impact of macroeconomic data.
Conclusion: Short-term pressure exists; medium- to long-term prospects remain to be seen.
The current pullback in gold and silver prices is more due to technical profit-taking, leveraged position liquidation, and portfolio rebalancing than a complete reversal in macroeconomic fundamentals. The failure of traditional correlation logic serves as a reminder that in an era of high volatility, the market is increasingly driven by short-term capital flows and technical trading, rather than a single narrative.
In the short term, bearish pressure remains dominant, and caution is advised when considering long positions, while paying attention to the aforementioned key technical levels. However, from a medium- to long-term perspective, the fundamentals of the structural bull market in precious metals remain unshaken—factors such as continued central bank gold purchases, geopolitical uncertainties, and potential inflationary pressures continue to provide support.
The release of non-farm payroll data, regardless of the outcome, will serve as a crucial window into the effectiveness of current macroeconomic explanations and may pave the way for the next round of trend-driven market movements. Traders need to remain flexible, strictly adhere to risk control, and seek structural opportunities amidst volatility.
However, common macroeconomic explanations—such as the rapid rise in US Treasury yields and the simultaneous strengthening of the US dollar index—appear rather far-fetched and are hardly convincing. Correlation analysis shows that the correlation between precious metal prices and US Treasury yields and the US dollar index has weakened significantly over the past week, and even lacks a clear correlation with energy futures (such as crude oil) and the market volatility index (VIX). This inevitably raises suspicions that there may be other, more direct forces driving the market.
Profit taking and position adjustment: A simpler explanation
Instead of getting bogged down in grand narratives, let's return to the simplest logic: taking profits. Despite a large-scale liquidation at the end of January, many traders and institutional investors still hold substantial unrealized gains. Gold recently approached or broke through the $5200 mark, while silver fluctuated wildly in the $80-90 range; these gains have provided substantial returns for those holding positions.
When other assets (such as stocks or risky commodities) experience a synchronized correction or loss, it is perfectly normal to reduce holdings of gold and silver to raise funds, replenish margin, or reallocate positions. Such behavior often erupts at high levels, forming a waterfall-like decline rather than a gradual adjustment.
More notably, precious metals have recently deviated significantly from their traditional role as safe-haven assets, exhibiting volatility characteristics closer to high-beta risk assets—sometimes even exceeding Bitcoin's intraday swings. They no longer simply follow risk aversion but are increasingly driven by speculative capital, leveraged trading, and short-term sentiment. This also explains why the influence of macroeconomic data (such as employment and inflation expectations) has weakened in the short term.
Technical analysis dominates short-term trading logic
In shorter timeframes (such as the 4-hour chart), a striking feature is that traders are increasingly relying on charts and technical levels for their operations, rather than blindly chasing news or macroeconomic narratives. Prices repeatedly oscillate within previously key ranges, and despite daily conflicting news (such as geopolitical tensions and expectations regarding Federal Reserve policy), these clear technical support/resistance levels at least provide a quantifiable reference framework for both bulls and bears, preventing completely chaotic trading.
Silver: Bears temporarily have the upper hand.
Silver prices have been trending lower on the 4-hour chart recently, with each new high being lower than the previous one, indicating significant downward pressure. Momentum indicators further confirm this assessment: the 14-period RSI continues to hover below 50 and shows a downward trend; the MACD line has crossed below the signal line and remains in negative territory.
This doesn't mean the bears have completely taken control of the market, but the current selling pressure is quite clear. Strategically, selling on rallies is more suitable. Unless the price effectively stabilizes above $86, the short-term bearish bias is unlikely to reverse. Earlier this week, silver encountered resistance near $86, subsequently forming a clear reversal candlestick pattern and initiating a series of declines. If it can return above $86, the short-term downtrend structure will be broken, and the trend may reverse.
Key points for reference:
Support levels: Significant buying interest has recently emerged around $80; $79.30 is more crucial – it was effectively broken at the end of February and has been tested multiple times this month, with brief dips followed by quick recoverys. If it retests this level, the previous low of $78 should be watched closely; further down, $76.30 is a secondary support level, and then the area around the February 18 low of $72 should be monitored.
Resistance levels: $86 remains a strong resistance level that has seen multiple shifts between bullish and bearish trends this year. A successful break above this level would dismantle the short-term bearish structure and could lead to a rebound to the next support level of $91.30–$92.20.
Gold: Bears find support around $5200
Gold's price action mirrored silver's. On the 4-hour chart, after touching $5200 at the beginning of the week, it encountered heavy selling pressure and fell significantly. Similarly, the 14-period RSI is below 50, and the MACD line has crossed below the signal line and is in negative territory, temporarily establishing a short-term bearish advantage.
(Spot gold daily chart source: FX678)
Key points for reference:
Resistance levels: Besides $5120 (which received buying support before Thursday's sharp drop), $5200 remains a key resistance level. If $5120 is tested again on Friday and encounters resistance, it's suitable for short-term shorting, with a stop-loss order placed above that level. If it can hold above $5200, the directional risk will shift to the bulls, potentially leading to a retest of the late January high of $5420.
Support levels below: $5,000 – where the price found support on Tuesday; $4,965 – which has acted as both support and resistance multiple times in the past; $4,850 – a break below this swing low could trigger a larger pullback.
Non-farm payroll data: A crucial test of macroeconomic narratives
The US non-farm payroll report (February data) to be released tonight is likely to trigger a new round of sharp market fluctuations, bringing significant trading opportunities for gold and silver.
The mainstream macroeconomic logic has consistently held that:
Weak data → weakening US dollar and US Treasury yields → positive for gold and silver;
Strong data → Rising US dollar and yields → Negative for gold and silver.
However, reality is often far more complex than models. Strong economic data earlier this week supported US stocks, but if the non-farm payrolls report is again unexpectedly strong, it could trigger a general weakening of risk assets (stock market correction, decreased risk appetite), thus putting precious metals to the test of their "true nature"—are they still safe havens, or have they partially become amplifiers of risk assets?
In fact, while non-farm payrolls have historically been a major driver of economic activity, traders are likely to focus more on breaking geopolitical news than on a relatively lagging labor market report before the weekend. Any new developments in geopolitical risks could instantly ignite risk aversion, overshadowing the short-term impact of macroeconomic data.
Conclusion: Short-term pressure exists; medium- to long-term prospects remain to be seen.
The current pullback in gold and silver prices is more due to technical profit-taking, leveraged position liquidation, and portfolio rebalancing than a complete reversal in macroeconomic fundamentals. The failure of traditional correlation logic serves as a reminder that in an era of high volatility, the market is increasingly driven by short-term capital flows and technical trading, rather than a single narrative.
In the short term, bearish pressure remains dominant, and caution is advised when considering long positions, while paying attention to the aforementioned key technical levels. However, from a medium- to long-term perspective, the fundamentals of the structural bull market in precious metals remain unshaken—factors such as continued central bank gold purchases, geopolitical uncertainties, and potential inflationary pressures continue to provide support.
The release of non-farm payroll data, regardless of the outcome, will serve as a crucial window into the effectiveness of current macroeconomic explanations and may pave the way for the next round of trend-driven market movements. Traders need to remain flexible, strictly adhere to risk control, and seek structural opportunities amidst volatility.
- Risk Warning and Disclaimer
- The market involves risk, and trading may not be suitable for all investors. This article is for reference only and does not constitute personal investment advice, nor does it take into account certain users’ specific investment objectives, financial situation, or other needs. Any investment decisions made based on this information are at your own risk.