Oil prices hit the $100 curse again: After the S&P 500 broke through, the abyss reappeared.
2026-03-09 21:18:29
On Monday, March 9th, before the US market opened, the S&P 500 index had fallen below levels near its December 2025 low during the previous session, currently hovering around 6740 points, a significant drop from its previous high of 7002 points. Amid rising risk aversion due to geopolitical factors, traders are assessing the profound impact of rising energy prices on the overall economy and asset pricing. The rapid rise in oil prices not only tests the market's resilience but also highlights the fragility of global supply chains and the complexity of policy responses.
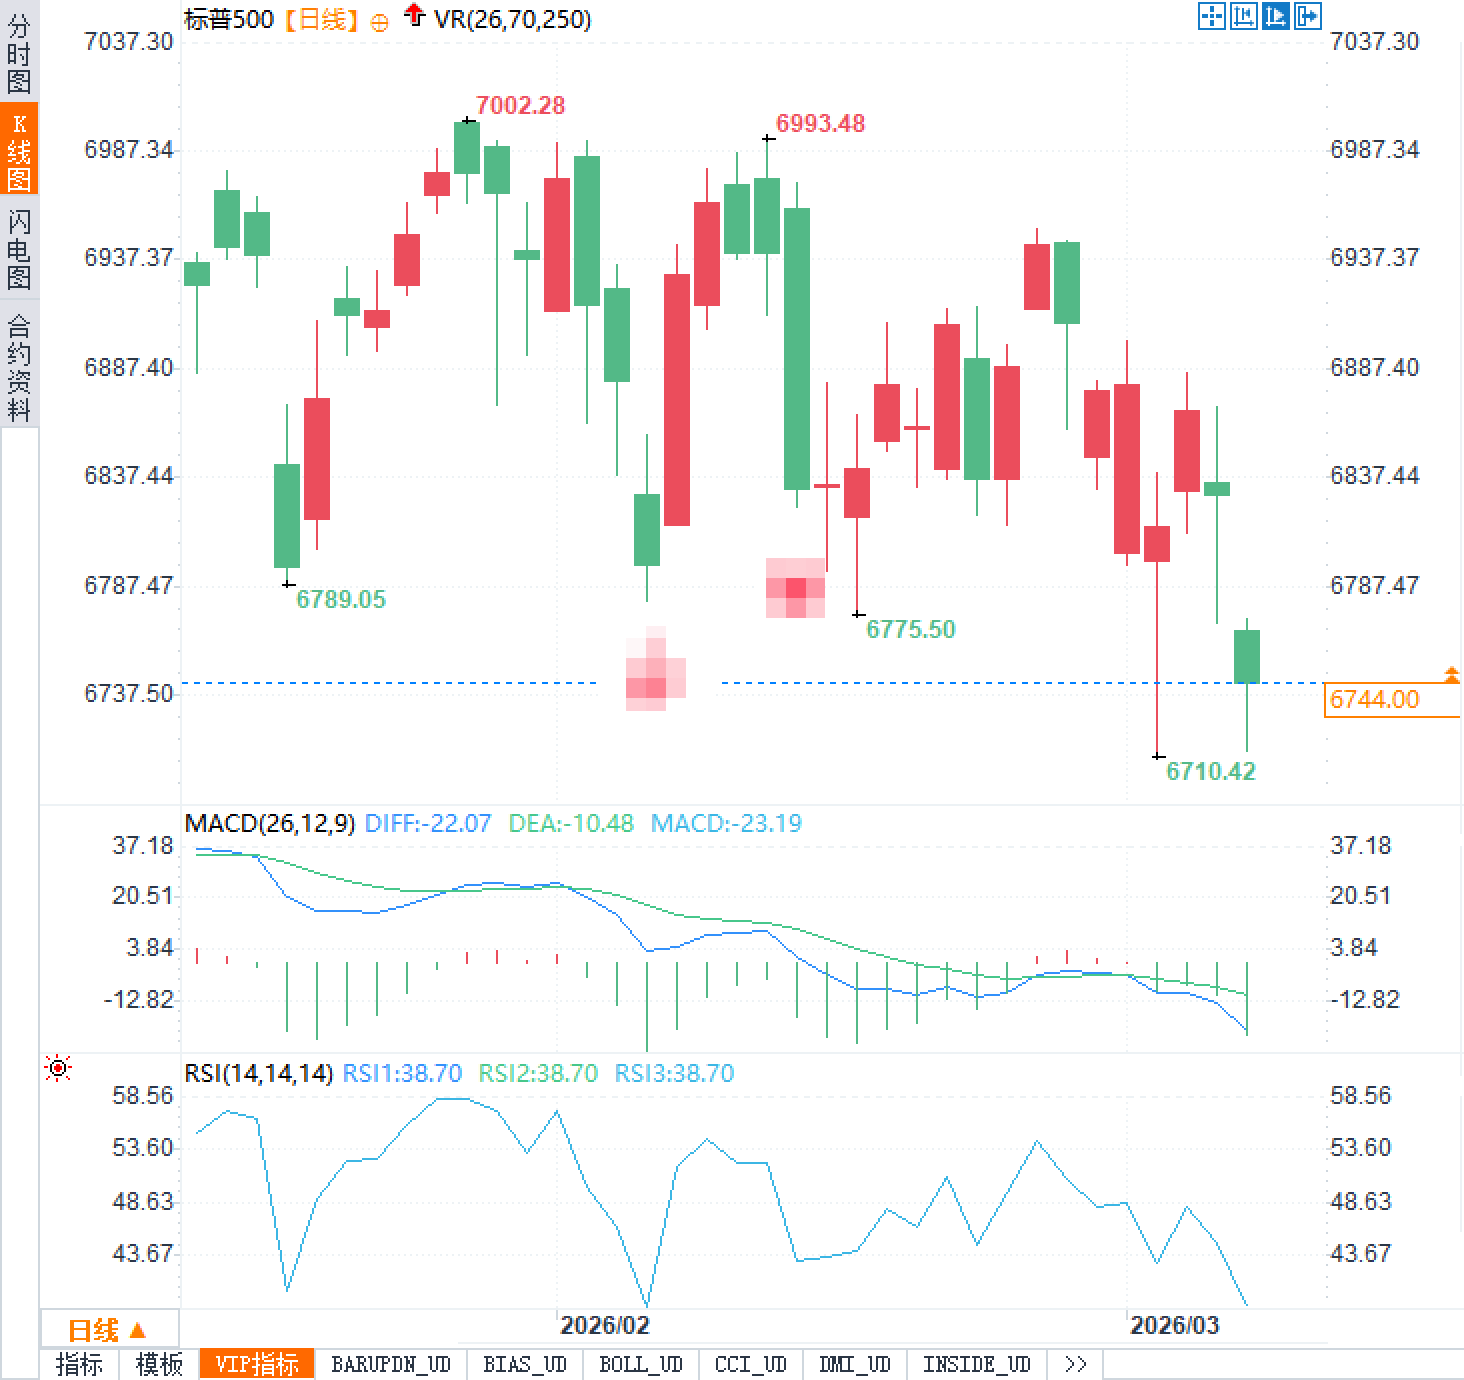
The S&P 500 index has recently exhibited a clear breakdown pattern. Since falling from its high of 7002 points, the index has repeatedly attempted to rebound but failed to hold key resistance levels. Entering March, with the accelerated rise in oil prices, selling pressure gradually accumulated, ultimately leading to a decisive break below the 6780-point area. This breakdown not only opens up room for a retracement to the lower level of 6530 points but also reinforces the confirmation of the short-term downtrend. The candlestick pattern shows a series of recent bearish candles, reflecting the gradual weakening of bullish momentum and the continued release of selling pressure. The recent low has reached around 6710 points, and short-term support is facing a severe test.
To clearly illustrate key levels, the following table lists a comparison of recent important price levels:
Crude oil prices have entered the $100-$103 per barrel range, primarily due to the ongoing geopolitical tensions in the Middle East, with concerns about supply disruptions driving up futures premiums. Rising energy costs directly squeeze corporate profit margins, with the transportation, manufacturing, and chemical industries bearing the brunt, challenging supply chain stability. At the consumer level, high oil prices increase living expenses, suppressing retail demand and durable goods consumption, leading to overall weak demand. Industry differentiation is intensifying: the energy sector is relatively resilient, while cyclical consumer and transportation-related sectors are under significant pressure. Historically, similar energy price shocks have often resulted in a period of stock market correction, with economic growth expectations subsequently revised downwards. In the current environment, every $10 increase in oil prices could potentially accumulate 0.2 to 0.5 percentage points of inflationary pressure, directly impacting corporate pricing and investment decisions, amplifying market volatility.
High oil prices have exacerbated inflation expectations, posing a stagflation risk to policymakers. The Federal Reserve faces limited room for maneuver in balancing economic growth and price stability goals, and market expectations for the number of rate cuts in 2026 have been lowered, with some analysts suggesting a possible slowdown or even a halt in the pace of easing. High energy prices are seen as a short-term shock, but if the conflict drags on, negative growth expectations will further constrain policy flexibility. Declining business investment and slowing consumer spending create a negative feedback loop. Macroeconomic data shows that rising energy costs have begun to affect leading indicators such as the manufacturing purchasing managers' index, testing the resilience of the overall economy. Traders need to pay attention to any changes in policy signals, but in the current environment, weakening expectations for easing are a significant downward pressure on the market.
The overall market sentiment is neutral to bearish, with traders focusing on developments in the situation. If signs of de-escalation emerge, such as the resolution of supply risks or the achievement of relevant objectives, a sentiment-easing rebound could occur, with the index quickly recovering some lost ground. However, if the situation persists, the dual pressures of inflation and growth will continue to exert downward pressure, potentially leading to a larger correction in the index. Rising volatility accompanied by a downward opening of the Bollinger Bands suggests limited upside potential in the short term. Key variables lie in energy price movements and geopolitical dynamics; any positive developments could reverse risk appetite, but the current logic still points to cautious observation.
Index Technical Analysis
The S&P 500 index has recently exhibited a clear breakdown pattern. Since falling from its high of 7002 points, the index has repeatedly attempted to rebound but failed to hold key resistance levels. Entering March, with the accelerated rise in oil prices, selling pressure gradually accumulated, ultimately leading to a decisive break below the 6780-point area. This breakdown not only opens up room for a retracement to the lower level of 6530 points but also reinforces the confirmation of the short-term downtrend. The candlestick pattern shows a series of recent bearish candles, reflecting the gradual weakening of bullish momentum and the continued release of selling pressure. The recent low has reached around 6710 points, and short-term support is facing a severe test.
To clearly illustrate key levels, the following table lists a comparison of recent important price levels:
| Price range | Specific locations | Technical significance |
|---|---|---|
| recent highs | 7002 | Short-term strong resistance |
| December lows | 6845 | A breakthrough has been achieved. |
| Current closing price | 6744 | Latest level |
| Intraday low | 6711 | Short-term support test |
| November low | 6530 | Potential backtesting targets |
The transmission effect of soaring oil prices on the market
Crude oil prices have entered the $100-$103 per barrel range, primarily due to the ongoing geopolitical tensions in the Middle East, with concerns about supply disruptions driving up futures premiums. Rising energy costs directly squeeze corporate profit margins, with the transportation, manufacturing, and chemical industries bearing the brunt, challenging supply chain stability. At the consumer level, high oil prices increase living expenses, suppressing retail demand and durable goods consumption, leading to overall weak demand. Industry differentiation is intensifying: the energy sector is relatively resilient, while cyclical consumer and transportation-related sectors are under significant pressure. Historically, similar energy price shocks have often resulted in a period of stock market correction, with economic growth expectations subsequently revised downwards. In the current environment, every $10 increase in oil prices could potentially accumulate 0.2 to 0.5 percentage points of inflationary pressure, directly impacting corporate pricing and investment decisions, amplifying market volatility.
Policy dilemmas and macroeconomic expectations
High oil prices have exacerbated inflation expectations, posing a stagflation risk to policymakers. The Federal Reserve faces limited room for maneuver in balancing economic growth and price stability goals, and market expectations for the number of rate cuts in 2026 have been lowered, with some analysts suggesting a possible slowdown or even a halt in the pace of easing. High energy prices are seen as a short-term shock, but if the conflict drags on, negative growth expectations will further constrain policy flexibility. Declining business investment and slowing consumer spending create a negative feedback loop. Macroeconomic data shows that rising energy costs have begun to affect leading indicators such as the manufacturing purchasing managers' index, testing the resilience of the overall economy. Traders need to pay attention to any changes in policy signals, but in the current environment, weakening expectations for easing are a significant downward pressure on the market.
Outlook and Key Variables
The overall market sentiment is neutral to bearish, with traders focusing on developments in the situation. If signs of de-escalation emerge, such as the resolution of supply risks or the achievement of relevant objectives, a sentiment-easing rebound could occur, with the index quickly recovering some lost ground. However, if the situation persists, the dual pressures of inflation and growth will continue to exert downward pressure, potentially leading to a larger correction in the index. Rising volatility accompanied by a downward opening of the Bollinger Bands suggests limited upside potential in the short term. Key variables lie in energy price movements and geopolitical dynamics; any positive developments could reverse risk appetite, but the current logic still points to cautious observation.
Frequently Asked Questions
Question 1: What were the main drivers that caused the S&P 500 to fall below its December low?
A: The rapid rise in crude oil prices to over $100 per barrel directly exacerbated market concerns about a rebound in inflation. At the same time, geopolitical uncertainties pushed up risk premiums, leading investors to sell off risky assets. The index subsequently broke through previous support levels, opening up further downside potential. This process is closely related to the transmission of energy costs to the real economy, compounded by supply chain uncertainties, creating multiple selling pressures.
Question 2: How do technical indicators reflect current market sentiment?
A: The MACD indicator shows the negative value widening to -23.19, indicating that bearish forces have gained the upper hand; the RSI is hovering around 38.70, at a relatively low level, suggesting insufficient momentum, but also approaching the potential oversold zone. Combined with the candlestick pattern and Bollinger Band opening, the overall picture shows that selling pressure remains, and the short-term trend is bearish. Traders can use this to assess the probability of a rebound, but need to combine it with fundamental confirmation of reversal signals.
Question 3: How will high oil prices affect the Federal Reserve's policy path?
A: Rising energy costs could push up overall price levels, making it more challenging for the Federal Reserve to balance growth and inflation targets. Market expectations for interest rate cuts have already been adjusted, and the pace of policy easing may slow or even pause. Historically, in similar situations, the risk of stagflation has often prolonged the adjustment period, and the limited policy space in the current environment will further suppress the speed of valuation recovery.
- Risk Warning and Disclaimer
- The market involves risk, and trading may not be suitable for all investors. This article is for reference only and does not constitute personal investment advice, nor does it take into account certain users’ specific investment objectives, financial situation, or other needs. Any investment decisions made based on this information are at your own risk.