Gold prices are caught in a tug-of-war between bulls and bears, facing the dual pressures of escalating stagflation concerns and a strengthening US dollar.
2026-03-10 01:50:29
On Monday (March 9th) during the afternoon Eastern Time/New York session, spot gold showed significant downward pressure, dominated by multiple negative factors including a stronger dollar, rising real yields, inflation concerns (high oil prices triggering stagflation risks), and delayed expectations of a Federal Reserve rate cut. It traded at $5093.78 per ounce, a decrease of 1.49%.

Rising real yields are the main pressure.
The surge in West Texas Intermediate (WTI) crude oil prices has fueled inflation expectations. The real yield on the 10-year U.S. Treasury note rose to around 4.128%, significantly increasing the opportunity cost of holding gold and dampening demand for it as a safe haven. Despite rising geopolitical risk premiums, gold failed to follow the significant gains seen in energy assets such as oil.
Stagflation Risk: The Federal Reserve's Policy Dilemma
Market concerns about stagflation (slower economic growth + rising inflation) have intensified. This situation could cause the Federal Reserve's anticipated 50-basis-point rate cut to fail, further increasing pressure on gold. The stagflationary environment complicates the Fed's monetary policy, with a stronger dollar and rising real yields becoming the dominant negative factors.
Market Performance and Current Dynamics
Spot gold is currently hovering between $5080 and $5100 per ounce, while April futures are near $5090. The US dollar index remains volatile at high levels, and oil prices have fallen back to around $95, indicating continued inflationary pressure. The US will release its February CPI data this Wednesday and the PCE index on Friday; if the data exceeds expectations, it could further exacerbate the pressure on gold.
Short-term focus:
Pay attention to the support level of $5000-$5046 and the resistance level of $5280 for gold.
In the short term, gold prices may fluctuate within these ranges, with potentially sharp swings during the Asian session.
The Federal Reserve's policy moves and escalating geopolitical risks could have a significant impact on gold prices.
Analyst Opinions
Bob Savage (BNY Markets Macro Strategy): Investors have not fully priced in the stagflation shock, and the correlation between oil and gold needs to be restored through higher oil prices or lower gold prices.
Jim Wyckoff (Senior Analyst at Kitco): A strong dollar and expectations of higher interest rates are driving short-term pressures, but the ongoing conflict in the Middle East is maintaining safe-haven demand. In the short term, watch the $5021 support level and the $5210 resistance level.
FXStreet: Gold is susceptible to the US-Iran war and Federal Reserve policies, and is expected to fluctuate between $5,000 and $5,200 in the short term. A rapid reversal could occur if geopolitical conflicts escalate.
4-hour technical analysis
Downside risk after breaking the uptrend line
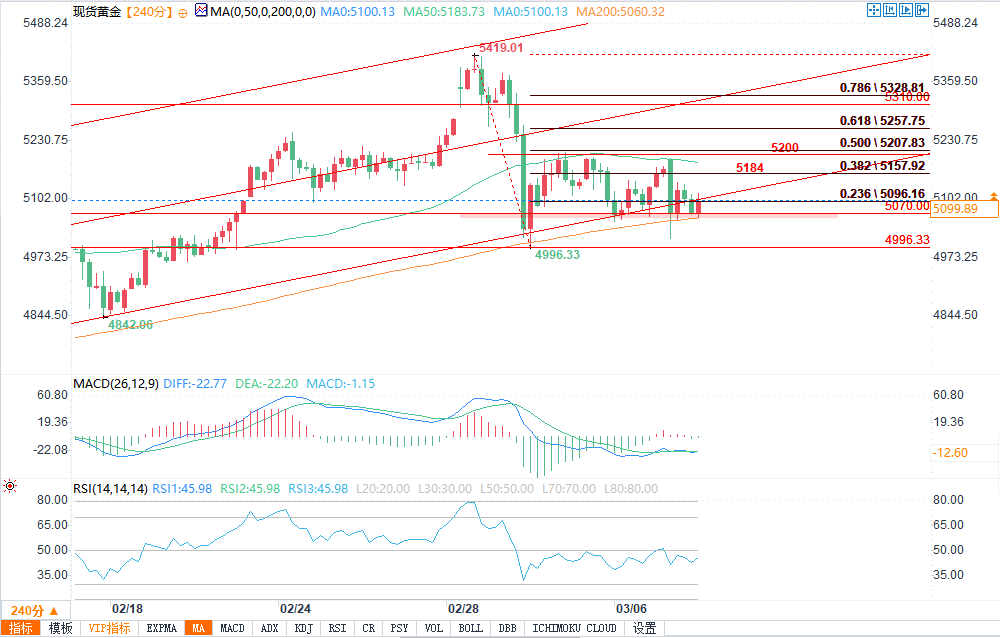
(4-hour chart of spot gold source: EasyForex)
From the 4-hour chart, spot gold has effectively broken below the previous medium-term uptrend line, signifying the breakdown of the 4-hour uptrend structure and a downward shift in market focus. The key support area below is formed by the recent low (around 5070) and the 200-period moving average (5060.32), representing the last line of defense for the bulls on the 4-hour chart. If this support zone is decisively broken, bearish momentum will be further released, and the price will likely test the previous low of 4996.33, or even explore stronger support levels below 4996.33.
The 50-day moving average and Fibonacci levels form key resistance.
Regarding the 4-hour chart's rebound, the primary resistance level is the 50-period moving average (5183.73), which coincides with the 0.5 Fibonacci retracement level (5207.83) and the psychological level around 5200, forming a strong composite resistance zone. This is a key point for judging the strength of the 4-hour rebound: if the price can strongly break through this area, it will open up more room for a rebound, with the next target pointing to the 0.786 Fibonacci level (5328.81); conversely, if it is rejected and falls back here, it will strengthen the current weak trend.
The market is currently locked in a stalemate between bulls and bears, awaiting a directional move.
Currently, spot gold prices are oscillating within a narrow range between the 50-period and 200-period moving averages, indicating a temporary balance between bullish and bearish forces on the 4-hour chart. Technically, the MACD shows that bearish momentum remains but has weakened; the RSI is in a neutral-to-low position, suggesting that market sentiment on the 4-hour chart is bearish but has not yet reached extreme oversold levels. This "sandwiched between moving averages" state often represents a consolidation phase before a major move on the 4-hour chart. Subsequent price action will depend on whether the price breaks through the aforementioned support or resistance levels: a decisive break below would open up further downside potential, while a strong break above would restart a rebound.
Rising real yields are the main pressure.
The surge in West Texas Intermediate (WTI) crude oil prices has fueled inflation expectations. The real yield on the 10-year U.S. Treasury note rose to around 4.128%, significantly increasing the opportunity cost of holding gold and dampening demand for it as a safe haven. Despite rising geopolitical risk premiums, gold failed to follow the significant gains seen in energy assets such as oil.
Stagflation Risk: The Federal Reserve's Policy Dilemma
Market concerns about stagflation (slower economic growth + rising inflation) have intensified. This situation could cause the Federal Reserve's anticipated 50-basis-point rate cut to fail, further increasing pressure on gold. The stagflationary environment complicates the Fed's monetary policy, with a stronger dollar and rising real yields becoming the dominant negative factors.
Market Performance and Current Dynamics
Spot gold is currently hovering between $5080 and $5100 per ounce, while April futures are near $5090. The US dollar index remains volatile at high levels, and oil prices have fallen back to around $95, indicating continued inflationary pressure. The US will release its February CPI data this Wednesday and the PCE index on Friday; if the data exceeds expectations, it could further exacerbate the pressure on gold.
Short-term focus:
Pay attention to the support level of $5000-$5046 and the resistance level of $5280 for gold.
In the short term, gold prices may fluctuate within these ranges, with potentially sharp swings during the Asian session.
The Federal Reserve's policy moves and escalating geopolitical risks could have a significant impact on gold prices.
Analyst Opinions
Bob Savage (BNY Markets Macro Strategy): Investors have not fully priced in the stagflation shock, and the correlation between oil and gold needs to be restored through higher oil prices or lower gold prices.
Jim Wyckoff (Senior Analyst at Kitco): A strong dollar and expectations of higher interest rates are driving short-term pressures, but the ongoing conflict in the Middle East is maintaining safe-haven demand. In the short term, watch the $5021 support level and the $5210 resistance level.
FXStreet: Gold is susceptible to the US-Iran war and Federal Reserve policies, and is expected to fluctuate between $5,000 and $5,200 in the short term. A rapid reversal could occur if geopolitical conflicts escalate.
4-hour technical analysis
Downside risk after breaking the uptrend line
(4-hour chart of spot gold source: EasyForex)
From the 4-hour chart, spot gold has effectively broken below the previous medium-term uptrend line, signifying the breakdown of the 4-hour uptrend structure and a downward shift in market focus. The key support area below is formed by the recent low (around 5070) and the 200-period moving average (5060.32), representing the last line of defense for the bulls on the 4-hour chart. If this support zone is decisively broken, bearish momentum will be further released, and the price will likely test the previous low of 4996.33, or even explore stronger support levels below 4996.33.
The 50-day moving average and Fibonacci levels form key resistance.
Regarding the 4-hour chart's rebound, the primary resistance level is the 50-period moving average (5183.73), which coincides with the 0.5 Fibonacci retracement level (5207.83) and the psychological level around 5200, forming a strong composite resistance zone. This is a key point for judging the strength of the 4-hour rebound: if the price can strongly break through this area, it will open up more room for a rebound, with the next target pointing to the 0.786 Fibonacci level (5328.81); conversely, if it is rejected and falls back here, it will strengthen the current weak trend.
The market is currently locked in a stalemate between bulls and bears, awaiting a directional move.
Currently, spot gold prices are oscillating within a narrow range between the 50-period and 200-period moving averages, indicating a temporary balance between bullish and bearish forces on the 4-hour chart. Technically, the MACD shows that bearish momentum remains but has weakened; the RSI is in a neutral-to-low position, suggesting that market sentiment on the 4-hour chart is bearish but has not yet reached extreme oversold levels. This "sandwiched between moving averages" state often represents a consolidation phase before a major move on the 4-hour chart. Subsequent price action will depend on whether the price breaks through the aforementioned support or resistance levels: a decisive break below would open up further downside potential, while a strong break above would restart a rebound.
- Risk Warning and Disclaimer
- The market involves risk, and trading may not be suitable for all investors. This article is for reference only and does not constitute personal investment advice, nor does it take into account certain users’ specific investment objectives, financial situation, or other needs. Any investment decisions made based on this information are at your own risk.