Gold Analysis: The specter of inflation reappears; who will emerge victorious amidst the fog of price consolidation?
2026-03-12 19:35:12
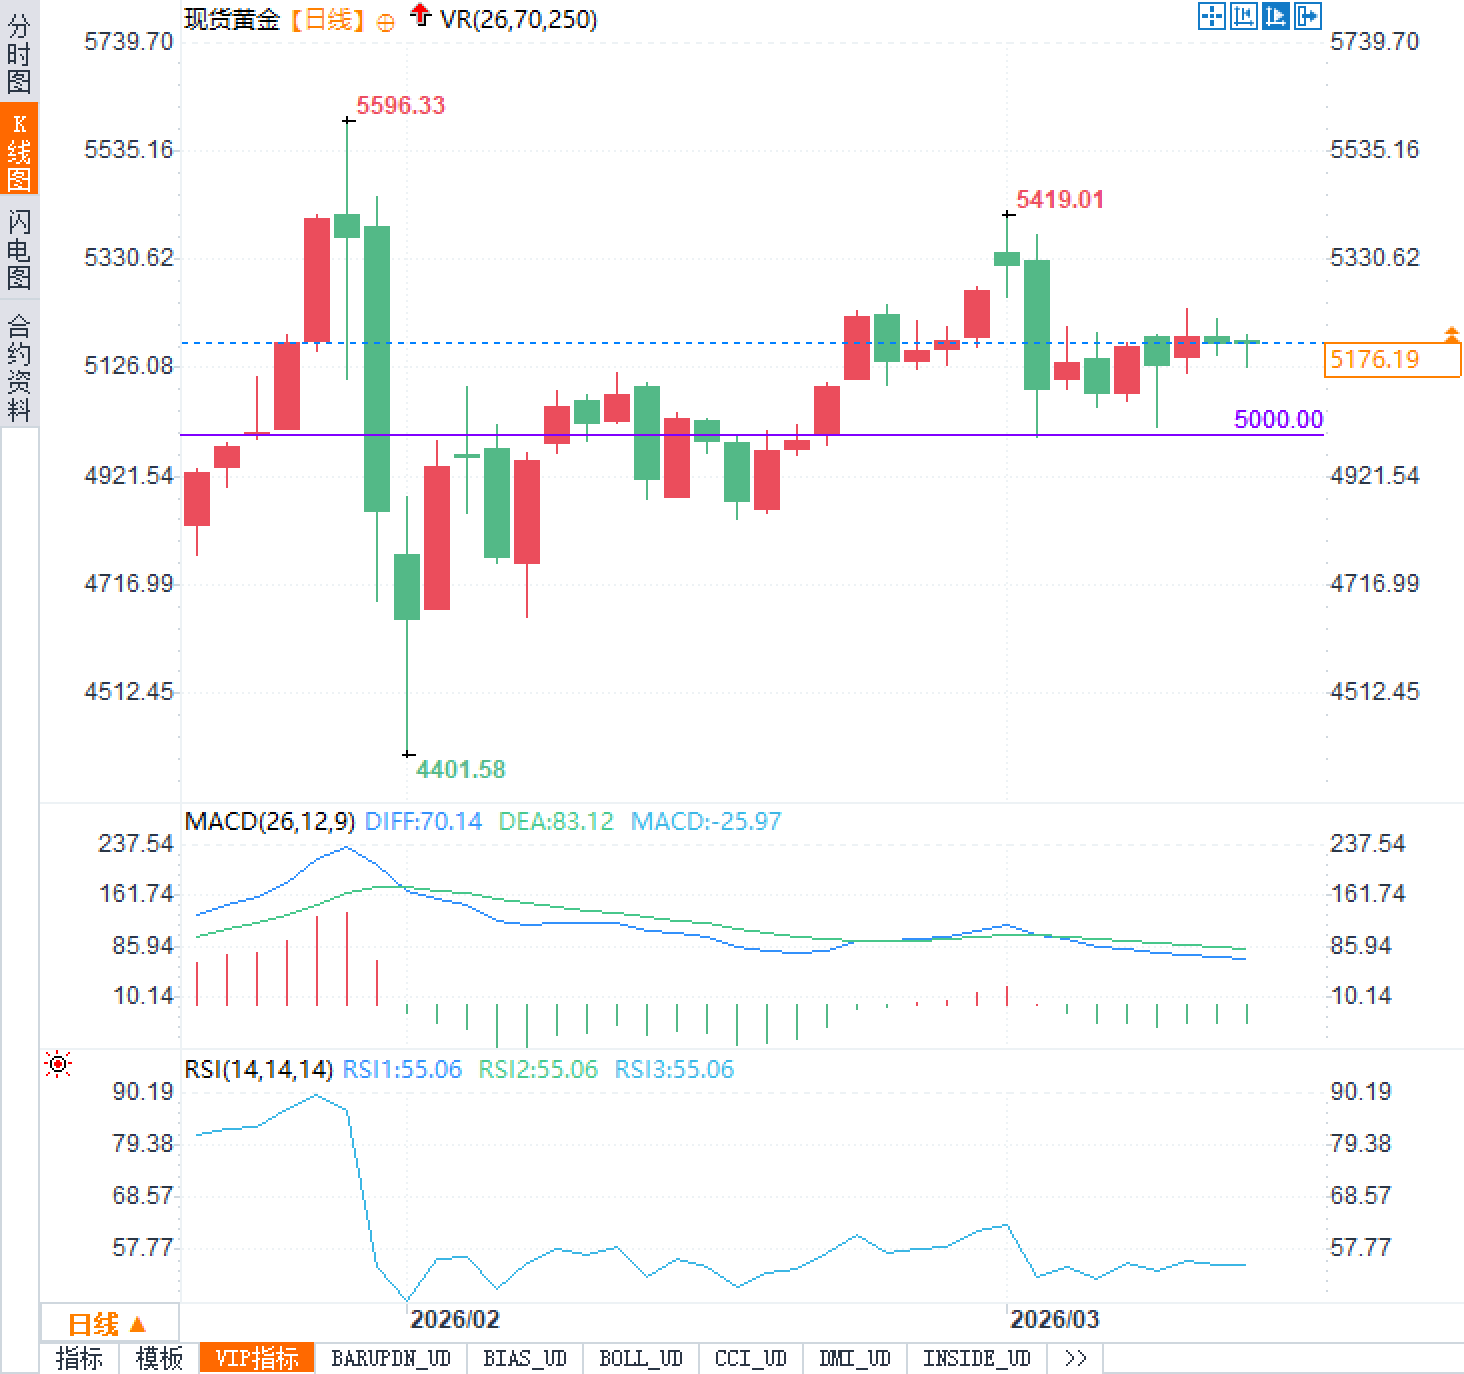
On Thursday, March 12, spot gold prices consolidated around $5180 per ounce during the European session. A previous strong rebound encountered significant resistance due to rising US Treasury yields and a stronger US dollar. A sharp rebound in oil prices reignited market concerns about the persistence of inflation, directly reducing the probability of a near-term interest rate cut by the Federal Reserve.
The latest US Consumer Price Index (CPI) for February showed a 0.3% month-over-month increase and remained stable at 2.4% year-over-year. While this is a slight decrease from the previous peak, it remains above the Federal Reserve's target range. Escalating tensions in the Middle East, including tanker attacks, have further increased uncertainty surrounding energy supplies. These intertwined macroeconomic and geopolitical factors have shaped the short-term price movement of gold.
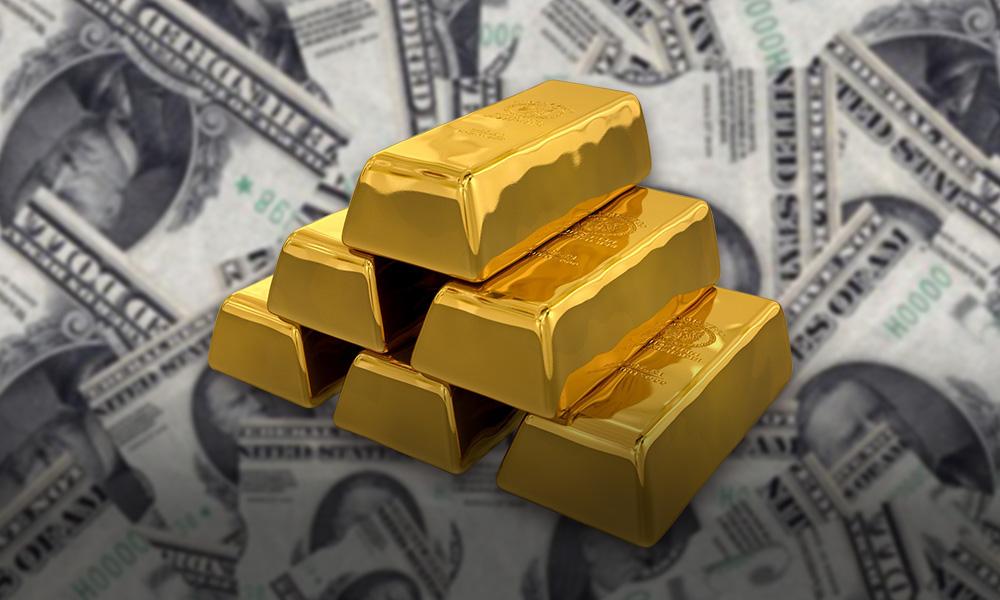
The gold market is currently consolidating below $5200/ounce, with the core pressure stemming from the dynamic imbalance between non-yielding assets and the yield environment. The US 10-year Treasury yield has risen to around 4.23%, directly increasing the opportunity cost of holding gold. The US dollar index hovering around 99.3 strengthens pricing pressure on overseas investors, as gold is priced in dollars, and a stronger dollar effectively raises the practical barrier to entry for global buyers. Simultaneously, crude oil prices have surged to $91.8/barrel, disrupting previous supply-demand balance expectations, and energy costs are being passed on to the overall price system, increasing the probability of a long-term inflationary path. These combined factors have made it difficult for gold to continue its previous upward trend, instead entering a period of high-level consolidation.
Traders need to pay attention to the synchronized movements of the yield curve and the US dollar index, as they together constitute the core restraining force on gold pricing. Rising yields not only reflect the market's repricing of inflation but also compress the room for monetary policy easing, further solidifying the support base for the US dollar.
The U.S. Consumer Price Index (CPI) for February, rising 0.3% month-over-month and 2.4% year-over-year, provides a clear signal of the inflation trajectory. While easing from historical highs, core pressures have not completely subsided, especially given the rebound in energy prices, leading to a significant adjustment in market expectations regarding the Federal Reserve's policy path. Fed officials have generally emphasized the need to maintain a cautious stance, keeping the target range for the federal funds rate stable, and compressing expectations for 1-2 rate cuts of around 25 basis points this year to around 1-2, with the timing pushed back.
This policy expectation correction directly impacts the bond market, pushing up yields and further enhancing the attractiveness of the US dollar. Some analysts believe traders should closely monitor the correlation between core inflation and energy prices, as every $1 increase in oil prices could amplify overall price pressures by 0.1-0.2 percentage points through supply chain transmission, thus prolonging the high-interest-rate environment. For gold, this means that real interest rates will remain high, continuously suppressing its attractiveness as a hedging tool.
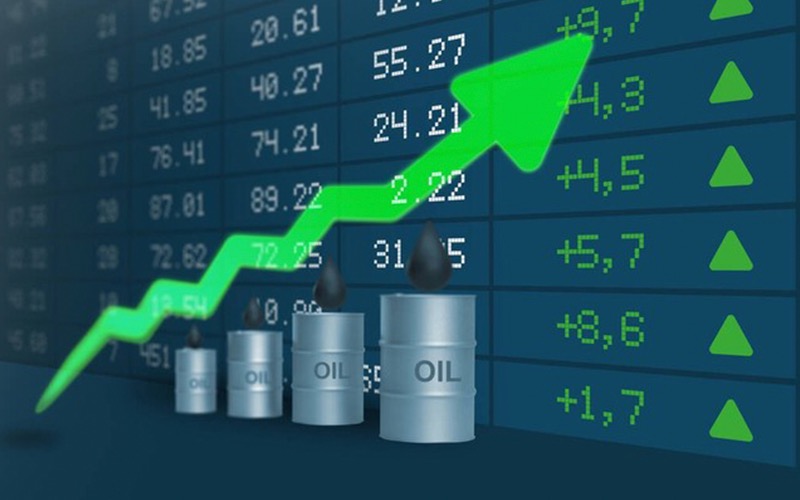
The escalating tensions in the Middle East, particularly the attacks on oil tankers in the northern Persian Gulf, have created a substantial risk of disruption to global energy supplies. Crude oil prices have surged by more than 5% in the short term, reflecting not only immediate supply concerns but also amplifying long-term inflation expectations. Disruptions to shipping through the Straits of Hormuz directly impact the export pace of major oil-producing countries, and the market fears this disruption will persist for weeks or even longer, thus embedding energy cost pressures into the global price system.
Gold, as a traditional safe-haven asset, should benefit from geopolitical uncertainty, but in this scenario, the transmission effect of energy prices has taken precedence. Inflation concerns triggered by rising oil prices have outweighed pure safe-haven demand, putting short-term pressure on gold. Traders need to distinguish between the short-term premium of geopolitical risks and the lasting impact of macroeconomic fundamentals; the former may provide intermittent support, while the latter constitutes systemic resistance.
The positive correlation between the US dollar index and US Treasury yields has been particularly pronounced in this round of market movements. For every 10 basis point increase in yields, the US dollar index typically strengthens by 0.2-0.3 basis points, directly amplifying the pricing disadvantage of gold. Currently, yields are in the 4.23% range, while the US dollar index remains stable at 99.3, together forming a ceiling for gold's upward movement. The degree of divergence between the two can be used to judge short-term reversal signals. If yields peak while the dollar stagnates, gold may have a chance to recover; conversely, a stronger correlation indicates increased risk at the lower end of the consolidation range.
The latest US Consumer Price Index (CPI) for February showed a 0.3% month-over-month increase and remained stable at 2.4% year-over-year. While this is a slight decrease from the previous peak, it remains above the Federal Reserve's target range. Escalating tensions in the Middle East, including tanker attacks, have further increased uncertainty surrounding energy supplies. These intertwined macroeconomic and geopolitical factors have shaped the short-term price movement of gold.
Macroeconomic drivers putting downward pressure on gold prices
The gold market is currently consolidating below $5200/ounce, with the core pressure stemming from the dynamic imbalance between non-yielding assets and the yield environment. The US 10-year Treasury yield has risen to around 4.23%, directly increasing the opportunity cost of holding gold. The US dollar index hovering around 99.3 strengthens pricing pressure on overseas investors, as gold is priced in dollars, and a stronger dollar effectively raises the practical barrier to entry for global buyers. Simultaneously, crude oil prices have surged to $91.8/barrel, disrupting previous supply-demand balance expectations, and energy costs are being passed on to the overall price system, increasing the probability of a long-term inflationary path. These combined factors have made it difficult for gold to continue its previous upward trend, instead entering a period of high-level consolidation.
Traders need to pay attention to the synchronized movements of the yield curve and the US dollar index, as they together constitute the core restraining force on gold pricing. Rising yields not only reflect the market's repricing of inflation but also compress the room for monetary policy easing, further solidifying the support base for the US dollar.
| Key Indicators | Latest value | Changes from the previous day |
|---|---|---|
| Gold (USD/ounce) | 5180 | +0.06% |
| US Dollar Index | 99.3 | +0.05% |
| 10-year Treasury yield | 4.23% | +0.02 percentage points |
| WTI crude oil (USD/barrel) | 91.8 | +5.2% |
| February CPI year-on-year rate | 2.4% | flat |
Analysis of the latest inflation data and the Federal Reserve's policy outlook
The U.S. Consumer Price Index (CPI) for February, rising 0.3% month-over-month and 2.4% year-over-year, provides a clear signal of the inflation trajectory. While easing from historical highs, core pressures have not completely subsided, especially given the rebound in energy prices, leading to a significant adjustment in market expectations regarding the Federal Reserve's policy path. Fed officials have generally emphasized the need to maintain a cautious stance, keeping the target range for the federal funds rate stable, and compressing expectations for 1-2 rate cuts of around 25 basis points this year to around 1-2, with the timing pushed back.
This policy expectation correction directly impacts the bond market, pushing up yields and further enhancing the attractiveness of the US dollar. Some analysts believe traders should closely monitor the correlation between core inflation and energy prices, as every $1 increase in oil prices could amplify overall price pressures by 0.1-0.2 percentage points through supply chain transmission, thus prolonging the high-interest-rate environment. For gold, this means that real interest rates will remain high, continuously suppressing its attractiveness as a hedging tool.
The impact of geopolitical tensions on energy supply and inflation expectations
The escalating tensions in the Middle East, particularly the attacks on oil tankers in the northern Persian Gulf, have created a substantial risk of disruption to global energy supplies. Crude oil prices have surged by more than 5% in the short term, reflecting not only immediate supply concerns but also amplifying long-term inflation expectations. Disruptions to shipping through the Straits of Hormuz directly impact the export pace of major oil-producing countries, and the market fears this disruption will persist for weeks or even longer, thus embedding energy cost pressures into the global price system.
Gold, as a traditional safe-haven asset, should benefit from geopolitical uncertainty, but in this scenario, the transmission effect of energy prices has taken precedence. Inflation concerns triggered by rising oil prices have outweighed pure safe-haven demand, putting short-term pressure on gold. Traders need to distinguish between the short-term premium of geopolitical risks and the lasting impact of macroeconomic fundamentals; the former may provide intermittent support, while the latter constitutes systemic resistance.
The correlation between the US dollar index and Treasury yields
The positive correlation between the US dollar index and US Treasury yields has been particularly pronounced in this round of market movements. For every 10 basis point increase in yields, the US dollar index typically strengthens by 0.2-0.3 basis points, directly amplifying the pricing disadvantage of gold. Currently, yields are in the 4.23% range, while the US dollar index remains stable at 99.3, together forming a ceiling for gold's upward movement. The degree of divergence between the two can be used to judge short-term reversal signals. If yields peak while the dollar stagnates, gold may have a chance to recover; conversely, a stronger correlation indicates increased risk at the lower end of the consolidation range.
Frequently Asked Questions
Question 1: Why has the price of gold entered a period of consolidation after its recent rise?
A: The core issue lies in the dual pressures of a stronger US dollar index to 99.3 and a 10-year Treasury yield rising to 4.23%, coupled with inflation expectations triggered by a rebound in crude oil prices, leading to a significant increase in the opportunity cost of holding gold. The stable 2.4% year-on-year CPI in February further confirms the limited room for policy easing, making it difficult for gold to break through $5200/ounce in the short term.
Question 2: What indirect impact does the rise in crude oil prices have on the price of gold?
A: Oil prices rising to $91.8 per barrel has pushed up the overall inflation trajectory, causing the market to lower its expectations for a Federal Reserve rate cut. Real interest rates remain high, directly weakening the attractiveness of gold. Although geopolitical tensions should have increased safe-haven demand, the energy cost transmission effect has prevailed, creating net downward pressure on gold.
Question 3: What macroeconomic signals should traders focus on to determine a turning point in gold prices?
A: The primary focus is on the correlation between the 10-year Treasury yield and the US dollar index. Secondly, we consider the Federal Reserve's policy meeting minutes regarding inflation and interest rate cuts, as well as the actual progress of energy supply disruptions in the Middle East. The synchronization or divergence of these signals will determine the direction of the breakout from the consolidation range.
- Risk Warning and Disclaimer
- The market involves risk, and trading may not be suitable for all investors. This article is for reference only and does not constitute personal investment advice, nor does it take into account certain users’ specific investment objectives, financial situation, or other needs. Any investment decisions made based on this information are at your own risk.