US Treasury bonds are creating a "double top" that is strangling gold! The $5,000 mark is in imminent danger. Will the weekend's developments be a lifeline?
2026-03-13 20:12:11
On Friday (March 13), global financial markets were at a crossroads of multiple macroeconomic pressures. Continued disturbances from the Middle East situation and energy price volatility have led to a strong co-existing expansion in US Treasury yields and the US dollar index . Latest data shows the US dollar index has surged to around 100.0909, nearing the upper Bollinger Band, indicating a significant flow of safe-haven funds into the dollar. This has exerted a clear pressure on traditional safe-haven assets, particularly spot gold.
Currently, market focus is heavily on the upcoming release of the US January core PCE price index. Due to the resilience of previous inflation data, the market widely expects the year-on-year growth rate of this indicator to reach 3.1%, far exceeding the Federal Reserve's annual target of 2.5%. This expectation of "high inflation and high interest rates" has significantly reduced market bets on a Fed rate cut this year, with a current probability of 50% that no rate cut will be implemented throughout the year. Against this backdrop, high US Treasury yields have directly increased the opportunity cost of holding gold, putting pressure on spot gold prices around $5094.86, leading to increased short-term volatility.

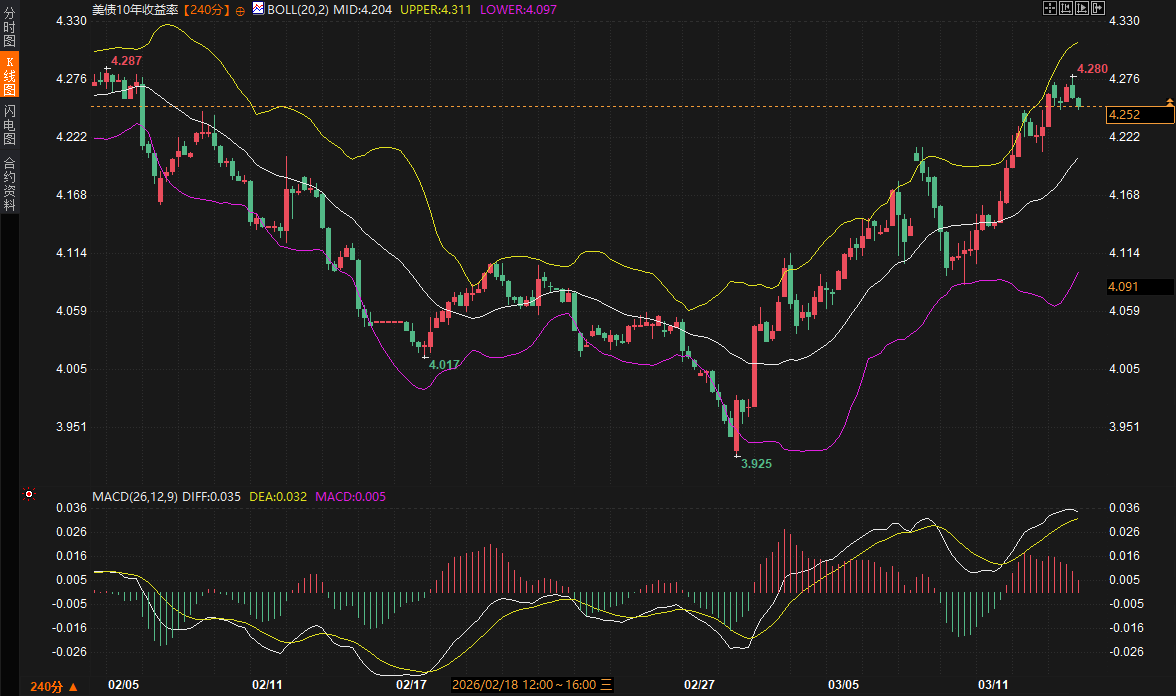
The recent performance of the US Treasury market is a key driver of global asset pricing. The 10-year US Treasury yield is currently at 4.252%, within the strong range between the Bollinger Band middle line (4.204) and the upper line (4.311). From a technical perspective, the yield fell back after reaching a high of 4.287 in early February, and has recently rebounded to around 4.280, forming a clear potential double-top pattern .
Fundamental Support: Leading institutions point out that current inflationary pressures were already evident before external factors intervened. The core PCE for January is projected to rise 0.4% month-on-month, reflecting persistently stubborn inflation in the service sector. Coupled with energy prices previously approaching triple-digit levels, short-selling momentum in the bond market continues to be released.
Technical resistance: Although the MACD indicator's two lines have crossed above the zero axis, the red bars are extremely narrowing, suggesting that upward momentum is weakening. If the yield fails to effectively break through the previous high resistance of 4.287, a pullback from the high is highly likely; conversely, if it breaks through this level, it will open up upward space to the 4.32% level.
Transmission of Safe-Haven Effect: Although the Russia-Ukraine situation and the Middle East situation should have supported safe-haven demand in the bond market (leading to lower yields), the current logic of "energy inflation" has overshadowed the logic of "simple safe-haven demand." Investors are worried that prolonged high inflation will force interest rates to remain high, and this expectation of "higher and longer" has led to a sell-off in the bond market, with yields remaining volatile at high levels.
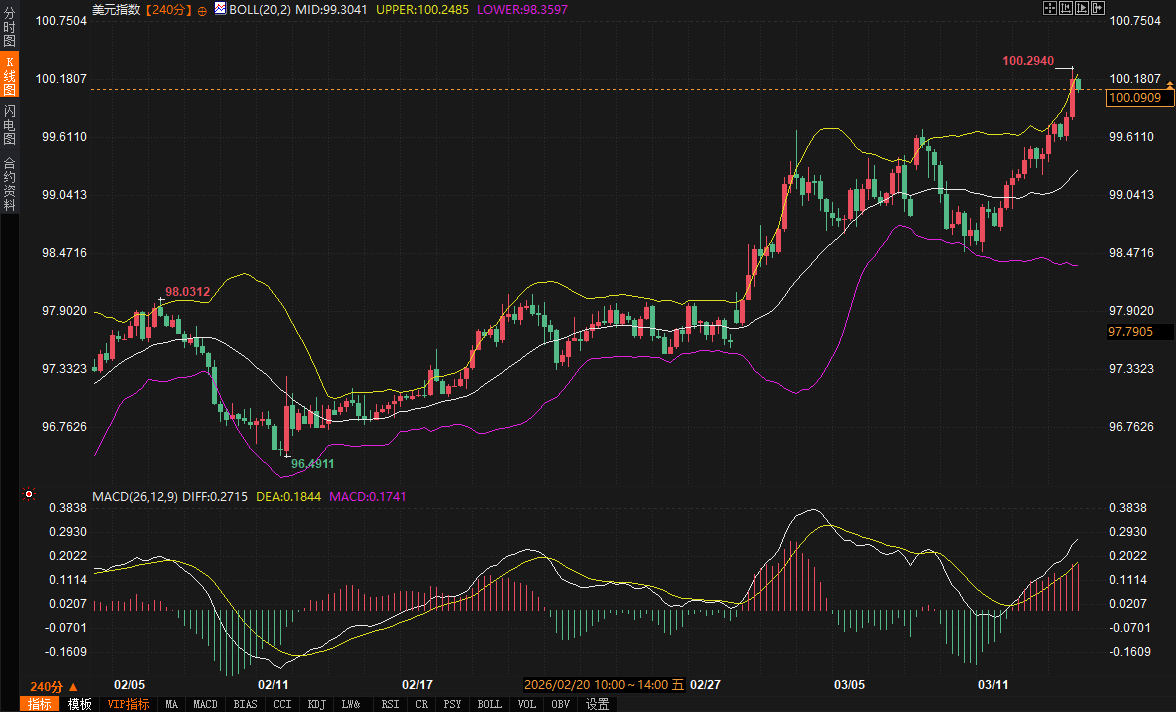
Driven by rising US Treasury yields, the US dollar index has exhibited extreme strength. Currently quoted at 100.0909, the price is steadily rising along the upper Bollinger Band. As the euro and pound sterling are sold off due to weak economic data, the dollar's status as a single safe-haven asset has been amplified.
From a technical perspective, the MACD histogram for the US dollar index remains bullish, indicating a clear uptrend. However, the DIFF and DEA lines have entered high levels, raising concerns about a potential top divergence and a pullback . The key resistance level is currently between 100.18 and 100.29 (near the previous high). If this area fails to break out with significant volume, the dollar may face a short-term technical correction. However, as long as US Treasury yields remain above 4.2%, the downside for the dollar will be severely limited.
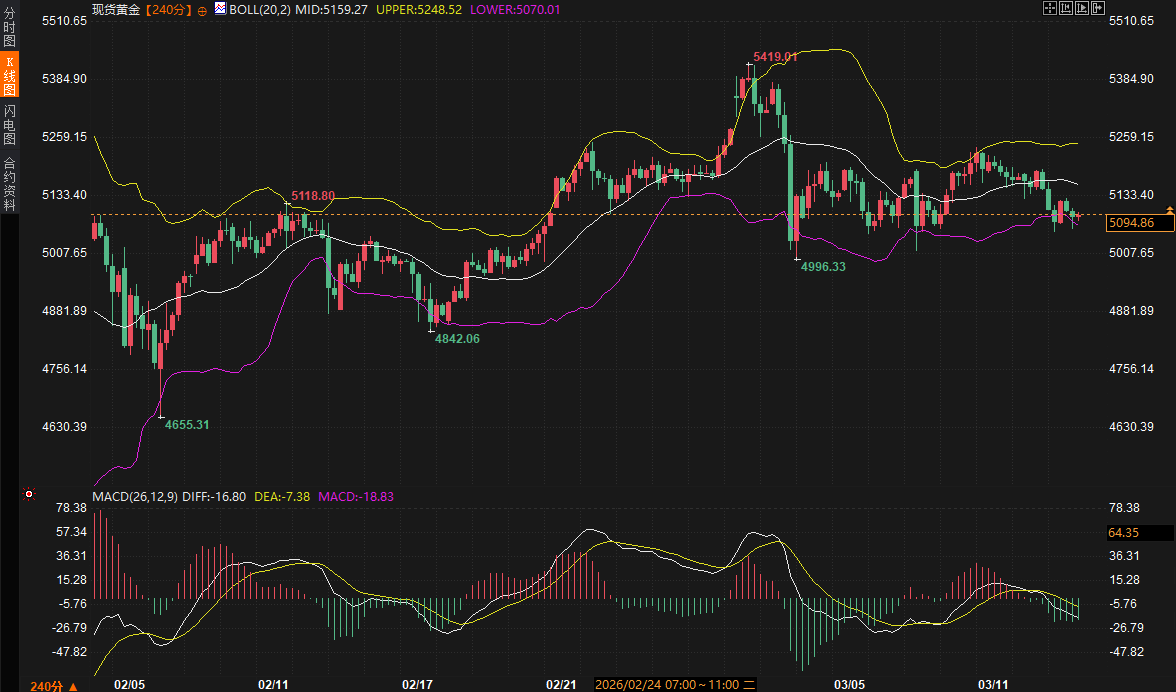
Under the dual pressure of US Treasury bonds and the US dollar, spot gold has recently weakened, recording its second consecutive week of decline. Gold is showing significant signs of a pullback and consolidation within the 4-hour (240-minute) timeframe.
1. Transmission Mechanism Logic: Generally, geopolitical risks (such as the current Russia-Ukraine situation and the Middle East situation) boost gold prices. However, when the US dollar and US Treasury yields surge simultaneously, gold's monetary attributes are suppressed. Some investors even choose to cash out their gold holdings to meet margin requirements in order to offset losses from fluctuations in the stock or oil markets.
2. Technical Analysis: Spot gold is currently priced at 5094.86, near the lower Bollinger Band at 5070. The MACD histogram continues to expand, indicating that bearish momentum is still being released. The price action is fluctuating between 5000 and 5150, showing a strong divergence between bulls and bears around the 5000 level.
3. Key Support Levels: Short-term core support is seen at 4996.33. If gold prices break below this level, the pullback may extend further; the upside resistance is focused on the upper edge of the trading range at 5118.80.
Looking ahead to the next two trading days, the market will be bombarded with the release of core PCE data and a flurry of economic indicators. Given the approaching Federal Reserve interest rate meeting next week, high volatility is highly likely to persist.
US Treasury and Dollar Outlook: The 10-year US Treasury yield is expected to fluctuate widely between 4.23% and 4.29% . If the PCE data rises as expected, the yield may retest the double-top resistance at 4.287. For the US dollar index, the strength of the resistance in the 100.18-100.36 range needs to be monitored. Due to the interest rate advantage, a deep pullback in the dollar is unlikely in the short term.
Gold Price Forecast: Gold's upside potential is limited until the bond market strengthens. The expected trading range is $ 4996- $5120.
Key Focus: Closely monitor whether the 10-year US Treasury yield falls back from around 4.28%. If the yield retreats after a surge, gold is likely to stabilize above the 5070 support level and attempt a corrective rebound. However, if the US dollar index effectively holds above 100.30, gold faces the risk of breaking below the 5000 mark.
Q1: Why did geopolitical risk aversion fail to drive a surge in gold prices, but instead caused the US dollar to rise?
In the current macroeconomic environment, the US dollar is gradually replacing gold as the "first safe-haven choice" for global investors. This is mainly because geopolitical conflicts (such as the situation in the Middle East) have directly driven up oil prices, and the rise in oil prices has triggered extreme market concerns about a rebound in inflation. Rising inflation expectations will drive up US Treasury yields, and the US dollar is highly positively correlated with US Treasury yields. When the US dollar possesses the dual attributes of "high interest" and "safe-haven," gold, which does not generate interest income, becomes relatively less attractive, leading to capital flowing to the US dollar rather than gold.
Q2: What guidance does the "double top pattern" mentioned in the US Treasury yield chart have for the subsequent trend?
In technical analysis, a double top is an important topping signal. The repeated resistance encountered by the 10-year US Treasury yield in the 4.28%-4.29% range indicates significant repurchase demand or resistance to high interest rates above this level. If the yield fails to break through the previous high of 4.287% in the next 2-3 days, it suggests that selling pressure in the bond market may be waning, and yields will likely decline. This is a crucial turning point for gold, as declining yields typically alleviate valuation pressures on gold.
Q3: If the upcoming core PCE data exceeds expectations, how will it be transmitted to gold through the bond market?
The transmission path is as follows: Core PCE exceeds expectations → Market confirms persistent inflation → Expectations for Fed rate cuts further cool (or even turn to expectations for rate hikes) → 10-year US Treasury yield breaks through the high resistance level of 4.287 → US dollar index strengthens in tandem → Gold falls below the $5,000 mark due to rising holding costs as the safe-haven premium is hedged.
Q4: The article mentions that investors sold gold to "make up for losses and gains." How should this be understood?
This is a typical liquidity spillover effect. When global stock or energy markets experience sharp fluctuations, leading to losses for large institutional investors or requiring emergency margin calls, gold, as one of the most liquid assets globally, is often the first to be liquidated to obtain cash flow. This sell-off is not due to a deterioration in gold's fundamentals, but rather because gold is being used as a "liquidity ATM." This situation is very common in the early stages of financial turmoil and often causes gold prices to deviate from fundamentals in the short term.
Q5: Is the current support logic for gold around $5,000 solid?
From a technical perspective, $5,000 is not only an important psychological level but also a strong support zone near the March pullback low of $4,996. Furthermore, despite the strong dollar, the complexity of the Middle East situation (such as issues surrounding maritime passages) continues to provide defensive buying support for gold at the bottom. As long as US Treasury yields do not experience an extreme upward breakout (such as stabilizing above 4.35%), buying interest in gold near the $5,000 level will remain very strong, demonstrating considerable resilience against price declines.
Currently, market focus is heavily on the upcoming release of the US January core PCE price index. Due to the resilience of previous inflation data, the market widely expects the year-on-year growth rate of this indicator to reach 3.1%, far exceeding the Federal Reserve's annual target of 2.5%. This expectation of "high inflation and high interest rates" has significantly reduced market bets on a Fed rate cut this year, with a current probability of 50% that no rate cut will be implemented throughout the year. Against this backdrop, high US Treasury yields have directly increased the opportunity cost of holding gold, putting pressure on spot gold prices around $5094.86, leading to increased short-term volatility.
US Treasury yields form a "double top" resistance: a game of strategy amid inflation expectations.
The recent performance of the US Treasury market is a key driver of global asset pricing. The 10-year US Treasury yield is currently at 4.252%, within the strong range between the Bollinger Band middle line (4.204) and the upper line (4.311). From a technical perspective, the yield fell back after reaching a high of 4.287 in early February, and has recently rebounded to around 4.280, forming a clear potential double-top pattern .
Fundamental Support: Leading institutions point out that current inflationary pressures were already evident before external factors intervened. The core PCE for January is projected to rise 0.4% month-on-month, reflecting persistently stubborn inflation in the service sector. Coupled with energy prices previously approaching triple-digit levels, short-selling momentum in the bond market continues to be released.
Technical resistance: Although the MACD indicator's two lines have crossed above the zero axis, the red bars are extremely narrowing, suggesting that upward momentum is weakening. If the yield fails to effectively break through the previous high resistance of 4.287, a pullback from the high is highly likely; conversely, if it breaks through this level, it will open up upward space to the 4.32% level.
Transmission of Safe-Haven Effect: Although the Russia-Ukraine situation and the Middle East situation should have supported safe-haven demand in the bond market (leading to lower yields), the current logic of "energy inflation" has overshadowed the logic of "simple safe-haven demand." Investors are worried that prolonged high inflation will force interest rates to remain high, and this expectation of "higher and longer" has led to a sell-off in the bond market, with yields remaining volatile at high levels.
US Dollar Index Approaches Key Resistance: Competition for Existing Market Shares Under Exchange Rate Premium
Driven by rising US Treasury yields, the US dollar index has exhibited extreme strength. Currently quoted at 100.0909, the price is steadily rising along the upper Bollinger Band. As the euro and pound sterling are sold off due to weak economic data, the dollar's status as a single safe-haven asset has been amplified.
From a technical perspective, the MACD histogram for the US dollar index remains bullish, indicating a clear uptrend. However, the DIFF and DEA lines have entered high levels, raising concerns about a potential top divergence and a pullback . The key resistance level is currently between 100.18 and 100.29 (near the previous high). If this area fails to break out with significant volume, the dollar may face a short-term technical correction. However, as long as US Treasury yields remain above 4.2%, the downside for the dollar will be severely limited.
Gold Focuses on Bond Market Transmission: The "Identity Reshaping" of Safe-Haven Assets
Under the dual pressure of US Treasury bonds and the US dollar, spot gold has recently weakened, recording its second consecutive week of decline. Gold is showing significant signs of a pullback and consolidation within the 4-hour (240-minute) timeframe.
1. Transmission Mechanism Logic: Generally, geopolitical risks (such as the current Russia-Ukraine situation and the Middle East situation) boost gold prices. However, when the US dollar and US Treasury yields surge simultaneously, gold's monetary attributes are suppressed. Some investors even choose to cash out their gold holdings to meet margin requirements in order to offset losses from fluctuations in the stock or oil markets.
2. Technical Analysis: Spot gold is currently priced at 5094.86, near the lower Bollinger Band at 5070. The MACD histogram continues to expand, indicating that bearish momentum is still being released. The price action is fluctuating between 5000 and 5150, showing a strong divergence between bulls and bears around the 5000 level.
3. Key Support Levels: Short-term core support is seen at 4996.33. If gold prices break below this level, the pullback may extend further; the upside resistance is focused on the upper edge of the trading range at 5118.80.
Outlook and range forecast for the next 2-3 days
Looking ahead to the next two trading days, the market will be bombarded with the release of core PCE data and a flurry of economic indicators. Given the approaching Federal Reserve interest rate meeting next week, high volatility is highly likely to persist.
US Treasury and Dollar Outlook: The 10-year US Treasury yield is expected to fluctuate widely between 4.23% and 4.29% . If the PCE data rises as expected, the yield may retest the double-top resistance at 4.287. For the US dollar index, the strength of the resistance in the 100.18-100.36 range needs to be monitored. Due to the interest rate advantage, a deep pullback in the dollar is unlikely in the short term.
Gold Price Forecast: Gold's upside potential is limited until the bond market strengthens. The expected trading range is $ 4996- $5120.
Key Focus: Closely monitor whether the 10-year US Treasury yield falls back from around 4.28%. If the yield retreats after a surge, gold is likely to stabilize above the 5070 support level and attempt a corrective rebound. However, if the US dollar index effectively holds above 100.30, gold faces the risk of breaking below the 5000 mark.
Frequently Asked Questions
Q1: Why did geopolitical risk aversion fail to drive a surge in gold prices, but instead caused the US dollar to rise?
In the current macroeconomic environment, the US dollar is gradually replacing gold as the "first safe-haven choice" for global investors. This is mainly because geopolitical conflicts (such as the situation in the Middle East) have directly driven up oil prices, and the rise in oil prices has triggered extreme market concerns about a rebound in inflation. Rising inflation expectations will drive up US Treasury yields, and the US dollar is highly positively correlated with US Treasury yields. When the US dollar possesses the dual attributes of "high interest" and "safe-haven," gold, which does not generate interest income, becomes relatively less attractive, leading to capital flowing to the US dollar rather than gold.
Q2: What guidance does the "double top pattern" mentioned in the US Treasury yield chart have for the subsequent trend?
In technical analysis, a double top is an important topping signal. The repeated resistance encountered by the 10-year US Treasury yield in the 4.28%-4.29% range indicates significant repurchase demand or resistance to high interest rates above this level. If the yield fails to break through the previous high of 4.287% in the next 2-3 days, it suggests that selling pressure in the bond market may be waning, and yields will likely decline. This is a crucial turning point for gold, as declining yields typically alleviate valuation pressures on gold.
Q3: If the upcoming core PCE data exceeds expectations, how will it be transmitted to gold through the bond market?
The transmission path is as follows: Core PCE exceeds expectations → Market confirms persistent inflation → Expectations for Fed rate cuts further cool (or even turn to expectations for rate hikes) → 10-year US Treasury yield breaks through the high resistance level of 4.287 → US dollar index strengthens in tandem → Gold falls below the $5,000 mark due to rising holding costs as the safe-haven premium is hedged.
Q4: The article mentions that investors sold gold to "make up for losses and gains." How should this be understood?
This is a typical liquidity spillover effect. When global stock or energy markets experience sharp fluctuations, leading to losses for large institutional investors or requiring emergency margin calls, gold, as one of the most liquid assets globally, is often the first to be liquidated to obtain cash flow. This sell-off is not due to a deterioration in gold's fundamentals, but rather because gold is being used as a "liquidity ATM." This situation is very common in the early stages of financial turmoil and often causes gold prices to deviate from fundamentals in the short term.
Q5: Is the current support logic for gold around $5,000 solid?
From a technical perspective, $5,000 is not only an important psychological level but also a strong support zone near the March pullback low of $4,996. Furthermore, despite the strong dollar, the complexity of the Middle East situation (such as issues surrounding maritime passages) continues to provide defensive buying support for gold at the bottom. As long as US Treasury yields do not experience an extreme upward breakout (such as stabilizing above 4.35%), buying interest in gold near the $5,000 level will remain very strong, demonstrating considerable resilience against price declines.
- Risk Warning and Disclaimer
- The market involves risk, and trading may not be suitable for all investors. This article is for reference only and does not constitute personal investment advice, nor does it take into account certain users’ specific investment objectives, financial situation, or other needs. Any investment decisions made based on this information are at your own risk.