The bond market is violently pricing in "double inflation": the survival logic after gold fell below $5,000!
2026-03-16 20:14:50
On Monday (March 16), global financial markets were experiencing a period of intense volatility triggered by geopolitical conflicts. As the situation in the Middle East evolves, particularly with the rising risk of spillover from strategic corridors, market pricing logic is undergoing a profound shift. Currently, the steep rise in US Treasury yields has become the core driver of asset pricing, reflecting not only a competition for safe-haven flows but also a radical preview of the upcoming week of central bank policy decisions and their potential shifts in policy paths.
The market presents a peculiar landscape of "logical hedging": on the one hand, as the news over the weekend did not deteriorate drastically, the decline in oil prices from their highs led to a brief recovery in risk appetite; on the other hand, deep-seated inflationary anxieties and supply pressures in the bond market are forcing investors to re-examine the defensive attributes of the US dollar and the safe-haven effectiveness of gold.

The recent strong recovery of the US dollar is essentially a product of a deep correction in the US Treasury market's expectations for Federal Reserve interest rate cuts. From a fundamental perspective, the US's status as a net oil exporter gives it a natural hedging advantage against energy shocks, a stark contrast to Europe, which is mired in an energy crisis.
1. A "hawkish" reconstruction of the yield curve
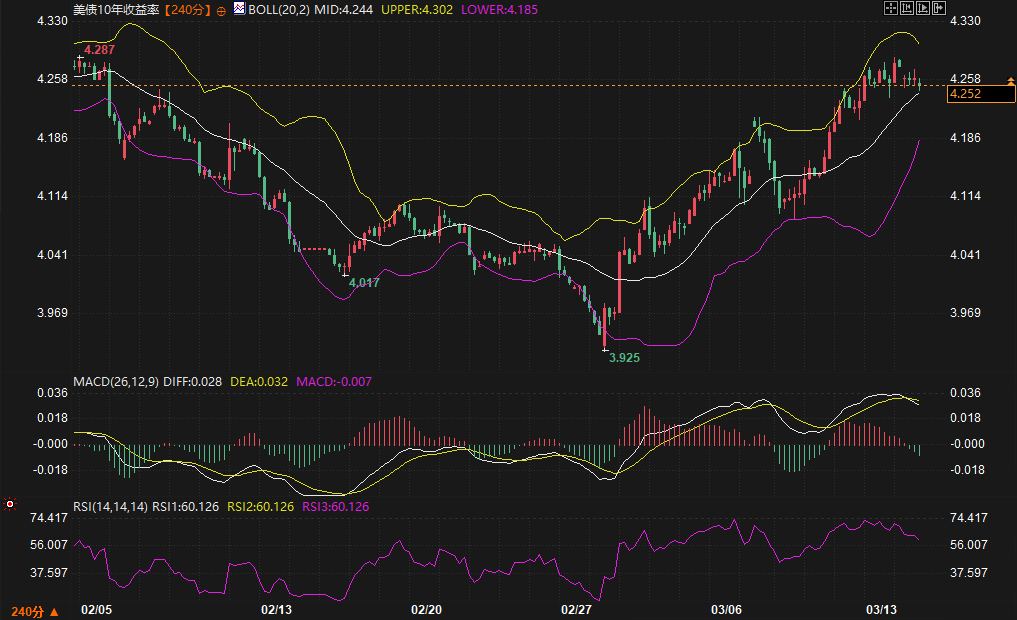
According to the latest data, the 10-year US Treasury yield has rebounded rapidly from 3.925% at the end of February to around 4.252% currently, showing a clear V-shaped reversal. On the 240-minute chart, the yield is running close to the upper Bollinger Band. Although the MACD indicates that the short-term upward momentum has weakened, the overall bullish pattern remains solid.
Transmission Mechanism: The bond market is digesting a stark reality—even against a backdrop of conflict, sticky inflation could force the Federal Reserve to maintain high interest rates for longer into 2026. The core PCE price index recorded a 0.4% monthly increase in January, a one-year high, directly leading to a significant reduction in market expectations for interest rate cuts this year.
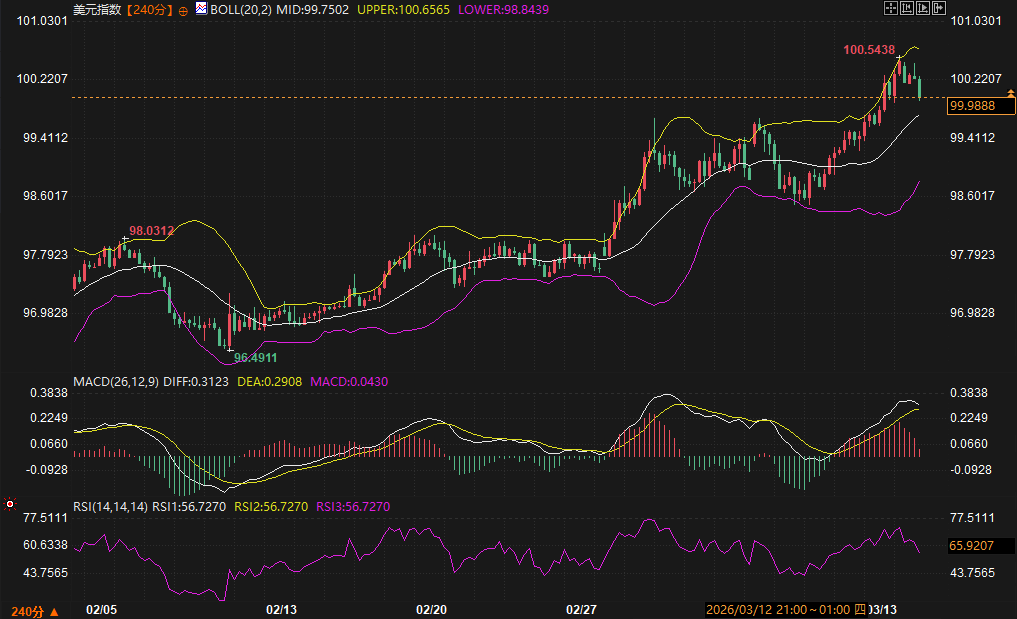
Dollar Support: High US Treasury yields have increased the attractiveness of dollar assets, and the US Dollar Index (DXY) recently broke through the 100.54 high. Although it has now retreated after encountering resistance at the 100 level, as long as the 10-year US Treasury yield stabilizes above 4.20%, the dollar's downside will be very limited.
2. Dual drivers of fiscal and tariff expectations
Market concerns are growing that rising expectations of double-dip inflation triggered by tariff rhetoric, coupled with large-scale U.S. Treasury auctions under pressure from the fiscal deficit (a $166 billion short-term bond auction is scheduled for today), will continue to push up long-term interest rates due to supply pressure in the bond market. This interest rate rise, driven by both inflation and fiscal factors, has built a solid moat for the U.S. dollar.
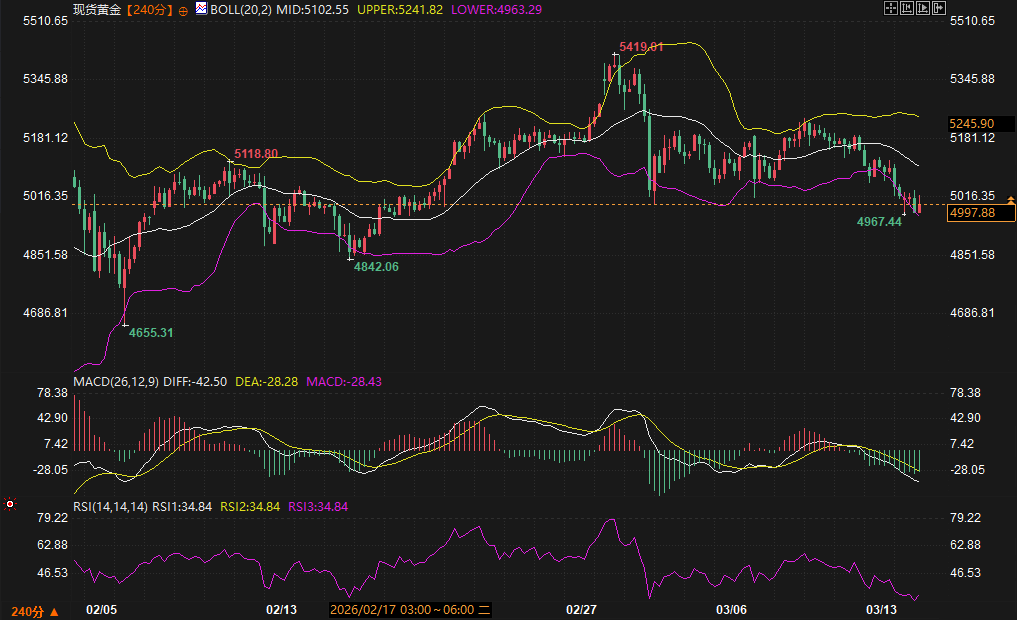
Traditional logic dictates that geopolitical conflicts should benefit gold, but recent spot gold prices have shown a significant structural correction. Gold prices have fallen from a high of $5419.01 at the end of February, currently trading below the $5000 mark. The underlying logic behind this divergence lies in the rising real interest rates transmitted through the bond market.
1. "Exclusive" competition among safe-haven assets
In the current macroeconomic environment, gold is facing fierce competition from US Treasury bonds. As the 10-year US Treasury yield approaches the key resistance level of 4.30%, the opportunity cost of holding gold, a non-interest-bearing asset, rises sharply.
The transmission logic in the bond market: As the market expects the Federal Reserve to adopt a "longer and higher" interest rate policy due to inflationary pressures, and some institutions have even begun to discuss the possibility of a rate hike in 2026, the inflation-hedging properties of gold have been offset by the surge in real interest rates.
Has the safe-haven effect failed? Not at all; rather, safe-haven funds are seeking more "cost-effective" destinations. With the US dollar possessing both safe-haven and high-interest attributes, gold's appeal has temporarily given way to the dollar and short-term US Treasury bonds.
2. Technical Oversold Conditions and Support Levels
From a technical perspective, the RSI on the 240-minute chart for gold has fallen to 34.84, entering the oversold zone, and the MACD histogram continues to expand, indicating that the release of bearish momentum is nearing its end.
Key points to watch in the market: Although the overall trend is downward, gold prices are currently trading near the lower Bollinger Band (4963.29), and the recent low of 4967.44 has shown some defensive strength. If the geopolitical situation deteriorates further due to the prolonged blockade of transportation routes, and if safe-haven buying in the bond market outperforms inflation expectations, gold may experience a retaliatory rebound after being oversold.
Over the next two to three trading days, the market will enter the lead-up to the Federal Reserve's FOMC meeting. As this is a quiet period, market volatility will be driven more by economic data (such as today's New York Fed Manufacturing Index and industrial production) and geopolitical developments.
1. Evolution of Macroeconomic Expectations
The market widely expects the Federal Reserve to keep interest rates unchanged, but the key focus is on the revision of the dot plot. If the Fed hints at reducing the number of rate cuts this year due to energy risks, US Treasury yields could hit 4.32%, at which point the dollar could return above 100.50, while gold could face the risk of testing the $4,900 level.
2. Support and resistance range prediction (referencing mainstream spot/main contract)
Q1: Why did gold prices fall sharply despite the escalation of geopolitical conflicts?
A: This reflects the complexity of the current market logic. While geopolitical risks can trigger risk aversion, this conflict has directly boosted expectations for oil prices (some executives have warned that oil prices could reach $120-150), exacerbating market fears of "double-dip inflation." The bond market's reaction has been to push up nominal interest rates, causing real interest rates (nominal interest rate minus inflation expectations) to strengthen rapidly at certain times. For gold, high bond yields constitute a significant "holding cost," leading to safe-haven funds flowing to the US dollar, which offers a more favorable interest rate differential.
Q2: Does the V-shaped reversal in US Treasury yields mean the complete end of the era of low interest rates?
A: The current V-shaped reversal is more of a correction to previously overly aggressive expectations of interest rate cuts. Looking at the available information, Federal Reserve officials have begun discussing the possibility of a rate hike in 2026, reflecting a wavering of policy confidence. Furthermore, as a major energy producer, the US economy is more resilient when energy prices rise, making it difficult for US Treasury yields to remain as low as those in Europe. In the short term, US Treasury yields are in the process of finding a new central level, and the 4.30% level will be a crucial watershed for measuring the market's medium- to long-term expectations.
Q3: Why has the US dollar index failed to extend its decline after falling below the 100 mark?
A: The dollar's resilience stems from a "better to be worse" logic. While the US faces inflationary pressures, Europe's situation is far more challenging. Given Europe's lack of energy offsetting mechanisms and its 50% dependence on international trade, the energy shock's impact on the Eurozone is structural. Among major central banks, the market expects the Reserve Bank of Australia to raise interest rates, but the ECB, even if it should, may hesitate due to debt pressures. This policy divergence and difference in economic fundamentals mean that every pullback in the dollar's price around 100 points attracts significant buying interest.
Q4: How will the drop in oil prices affect the market rhythm in the next 48 hours?
A: The pullback in oil prices from above $102 to around $97 has significantly alleviated the market's "extreme panic." This has provided a breathing space for the stock and bond markets, further squeezing out the short-term safe-haven premium for gold. In the next 48 hours, if oil prices remain volatile, the market focus will shift entirely to the Federal Reserve decision. It's important to note that this "calm" may be temporary; if the strategic passage (Strait of Hormuz) remains closed for longer than expected, the energy premium will again be transmitted to all assets through the bond market.
Q5: When focusing on technical analysis, which indicator should ordinary investors pay close attention to?
A: In the current volatile market, the middle band of the Bollinger Bands (BOLL) is a crucial dividing line between bullish and bearish trends. Taking the US Dollar Index as an example, as long as the price holds above 99.75 (middle band), the bullish trend remains intact. For gold, the area around 5100 (middle band) is a critical level for any rebound. Furthermore, given that the gold RSI is already in oversold territory, investors should pay attention to whether there is an "indicator divergence," where the price makes a new low while the RSI does not, which often signals a short-term trend reversal.
The market presents a peculiar landscape of "logical hedging": on the one hand, as the news over the weekend did not deteriorate drastically, the decline in oil prices from their highs led to a brief recovery in risk appetite; on the other hand, deep-seated inflationary anxieties and supply pressures in the bond market are forcing investors to re-examine the defensive attributes of the US dollar and the safe-haven effectiveness of gold.
The dollar's movements from the perspective of US Treasury bonds: Interest rate ladders reshape its dominant position.
The recent strong recovery of the US dollar is essentially a product of a deep correction in the US Treasury market's expectations for Federal Reserve interest rate cuts. From a fundamental perspective, the US's status as a net oil exporter gives it a natural hedging advantage against energy shocks, a stark contrast to Europe, which is mired in an energy crisis.
1. A "hawkish" reconstruction of the yield curve
According to the latest data, the 10-year US Treasury yield has rebounded rapidly from 3.925% at the end of February to around 4.252% currently, showing a clear V-shaped reversal. On the 240-minute chart, the yield is running close to the upper Bollinger Band. Although the MACD indicates that the short-term upward momentum has weakened, the overall bullish pattern remains solid.
Transmission Mechanism: The bond market is digesting a stark reality—even against a backdrop of conflict, sticky inflation could force the Federal Reserve to maintain high interest rates for longer into 2026. The core PCE price index recorded a 0.4% monthly increase in January, a one-year high, directly leading to a significant reduction in market expectations for interest rate cuts this year.
Dollar Support: High US Treasury yields have increased the attractiveness of dollar assets, and the US Dollar Index (DXY) recently broke through the 100.54 high. Although it has now retreated after encountering resistance at the 100 level, as long as the 10-year US Treasury yield stabilizes above 4.20%, the dollar's downside will be very limited.
2. Dual drivers of fiscal and tariff expectations
Market concerns are growing that rising expectations of double-dip inflation triggered by tariff rhetoric, coupled with large-scale U.S. Treasury auctions under pressure from the fiscal deficit (a $166 billion short-term bond auction is scheduled for today), will continue to push up long-term interest rates due to supply pressure in the bond market. This interest rate rise, driven by both inflation and fiscal factors, has built a solid moat for the U.S. dollar.
Structural divergence in the safe-haven effect of gold: bond market backlash and geopolitical hedging
Traditional logic dictates that geopolitical conflicts should benefit gold, but recent spot gold prices have shown a significant structural correction. Gold prices have fallen from a high of $5419.01 at the end of February, currently trading below the $5000 mark. The underlying logic behind this divergence lies in the rising real interest rates transmitted through the bond market.
1. "Exclusive" competition among safe-haven assets
In the current macroeconomic environment, gold is facing fierce competition from US Treasury bonds. As the 10-year US Treasury yield approaches the key resistance level of 4.30%, the opportunity cost of holding gold, a non-interest-bearing asset, rises sharply.
The transmission logic in the bond market: As the market expects the Federal Reserve to adopt a "longer and higher" interest rate policy due to inflationary pressures, and some institutions have even begun to discuss the possibility of a rate hike in 2026, the inflation-hedging properties of gold have been offset by the surge in real interest rates.
Has the safe-haven effect failed? Not at all; rather, safe-haven funds are seeking more "cost-effective" destinations. With the US dollar possessing both safe-haven and high-interest attributes, gold's appeal has temporarily given way to the dollar and short-term US Treasury bonds.
2. Technical Oversold Conditions and Support Levels
From a technical perspective, the RSI on the 240-minute chart for gold has fallen to 34.84, entering the oversold zone, and the MACD histogram continues to expand, indicating that the release of bearish momentum is nearing its end.
Key points to watch in the market: Although the overall trend is downward, gold prices are currently trading near the lower Bollinger Band (4963.29), and the recent low of 4967.44 has shown some defensive strength. If the geopolitical situation deteriorates further due to the prolonged blockade of transportation routes, and if safe-haven buying in the bond market outperforms inflation expectations, gold may experience a retaliatory rebound after being oversold.
Market Outlook and Range Forecast: Focusing on the "Fog" of the Central Bank's Decision
Over the next two to three trading days, the market will enter the lead-up to the Federal Reserve's FOMC meeting. As this is a quiet period, market volatility will be driven more by economic data (such as today's New York Fed Manufacturing Index and industrial production) and geopolitical developments.
1. Evolution of Macroeconomic Expectations
The market widely expects the Federal Reserve to keep interest rates unchanged, but the key focus is on the revision of the dot plot. If the Fed hints at reducing the number of rate cuts this year due to energy risks, US Treasury yields could hit 4.32%, at which point the dollar could return above 100.50, while gold could face the risk of testing the $4,900 level.
2. Support and resistance range prediction (referencing mainstream spot/main contract)
Frequently Asked Questions
Q1: Why did gold prices fall sharply despite the escalation of geopolitical conflicts?
A: This reflects the complexity of the current market logic. While geopolitical risks can trigger risk aversion, this conflict has directly boosted expectations for oil prices (some executives have warned that oil prices could reach $120-150), exacerbating market fears of "double-dip inflation." The bond market's reaction has been to push up nominal interest rates, causing real interest rates (nominal interest rate minus inflation expectations) to strengthen rapidly at certain times. For gold, high bond yields constitute a significant "holding cost," leading to safe-haven funds flowing to the US dollar, which offers a more favorable interest rate differential.
Q2: Does the V-shaped reversal in US Treasury yields mean the complete end of the era of low interest rates?
A: The current V-shaped reversal is more of a correction to previously overly aggressive expectations of interest rate cuts. Looking at the available information, Federal Reserve officials have begun discussing the possibility of a rate hike in 2026, reflecting a wavering of policy confidence. Furthermore, as a major energy producer, the US economy is more resilient when energy prices rise, making it difficult for US Treasury yields to remain as low as those in Europe. In the short term, US Treasury yields are in the process of finding a new central level, and the 4.30% level will be a crucial watershed for measuring the market's medium- to long-term expectations.
Q3: Why has the US dollar index failed to extend its decline after falling below the 100 mark?
A: The dollar's resilience stems from a "better to be worse" logic. While the US faces inflationary pressures, Europe's situation is far more challenging. Given Europe's lack of energy offsetting mechanisms and its 50% dependence on international trade, the energy shock's impact on the Eurozone is structural. Among major central banks, the market expects the Reserve Bank of Australia to raise interest rates, but the ECB, even if it should, may hesitate due to debt pressures. This policy divergence and difference in economic fundamentals mean that every pullback in the dollar's price around 100 points attracts significant buying interest.
Q4: How will the drop in oil prices affect the market rhythm in the next 48 hours?
A: The pullback in oil prices from above $102 to around $97 has significantly alleviated the market's "extreme panic." This has provided a breathing space for the stock and bond markets, further squeezing out the short-term safe-haven premium for gold. In the next 48 hours, if oil prices remain volatile, the market focus will shift entirely to the Federal Reserve decision. It's important to note that this "calm" may be temporary; if the strategic passage (Strait of Hormuz) remains closed for longer than expected, the energy premium will again be transmitted to all assets through the bond market.
Q5: When focusing on technical analysis, which indicator should ordinary investors pay close attention to?
A: In the current volatile market, the middle band of the Bollinger Bands (BOLL) is a crucial dividing line between bullish and bearish trends. Taking the US Dollar Index as an example, as long as the price holds above 99.75 (middle band), the bullish trend remains intact. For gold, the area around 5100 (middle band) is a critical level for any rebound. Furthermore, given that the gold RSI is already in oversold territory, investors should pay attention to whether there is an "indicator divergence," where the price makes a new low while the RSI does not, which often signals a short-term trend reversal.
- Risk Warning and Disclaimer
- The market involves risk, and trading may not be suitable for all investors. This article is for reference only and does not constitute personal investment advice, nor does it take into account certain users’ specific investment objectives, financial situation, or other needs. Any investment decisions made based on this information are at your own risk.