The battle to defend gold at $5,000 has entered a fierce stage; has the outcome already been decided this week?
2026-03-16 21:43:17
On Monday, March 16th, the precious metals market was in a highly tense, volatile phase. During the North American session, spot gold traded around $5020 per ounce, while spot silver faced downward pressure around $79-80 per ounce. The escalating geopolitical conflict in the Middle East kept oil prices high, with Brent crude hovering around $102 per barrel and WTI crude near $95 per barrel. This fueled expectations of energy-related inflation, thus limiting the flexibility of the Federal Reserve and other major central banks to shift towards easing. The US dollar index retreated slightly from its recent high, but its overall strength remained unchanged, limiting the upward momentum of safe-haven precious metals.
The Middle East situation entered its third week, with no signs of de-escalation in the US-Iran conflict. The US launched airstrikes on key Iranian military facilities on islands, and Trump publicly warned that if Iran interfered with shipping in the Strait of Hormuz, the US might take further action against its oil infrastructure. He also called on the UK, France, Japan, South Korea, and other countries to send warships to safeguard the waterway. Iranian Foreign Minister Araqchi responded that the strait is only closed to "enemies and their supporters." These statements have exacerbated market concerns about disruptions to the global energy supply chain.
Brent crude oil is currently priced at around $102 per barrel, up about 45%-50% from pre-conflict levels; WTI crude oil is around $95 per barrel, with a similar increase. High energy costs are being passed on to consumers, pushing up core inflationary pressures. The market is beginning to reassess the reaction functions of major central banks: if high oil prices persist, it could lead to increased stagflation risks, forcing policymakers to maintain higher interest rates for a longer period.
With the Federal Reserve's March interest rate meeting approaching, the market expects a very high probability that the target range of 3.50%-3.75% will remain unchanged. The CME FedWatch tool shows that the probability of a 25 basis point rate cut in June has fallen significantly to a low level, and the expected number of rate cuts for the whole year has been compressed from two to about one. The European Central Bank, the Bank of England, the Bank of Japan, and the Bank of Canada are also likely to hold rates steady this week, while the Reserve Bank of Australia may raise rates again. This consensus of "higher interest rates for longer" directly suppresses the attractiveness of gold, a non-interest-bearing asset.
Spot gold is currently trading around $5,020 per ounce, having dipped as low as $4,967 per ounce during the session, a three-week low. A retreat in the US dollar provided some support, but oil-driven inflation expectations dominated market sentiment, limiting the upside potential for gold prices.
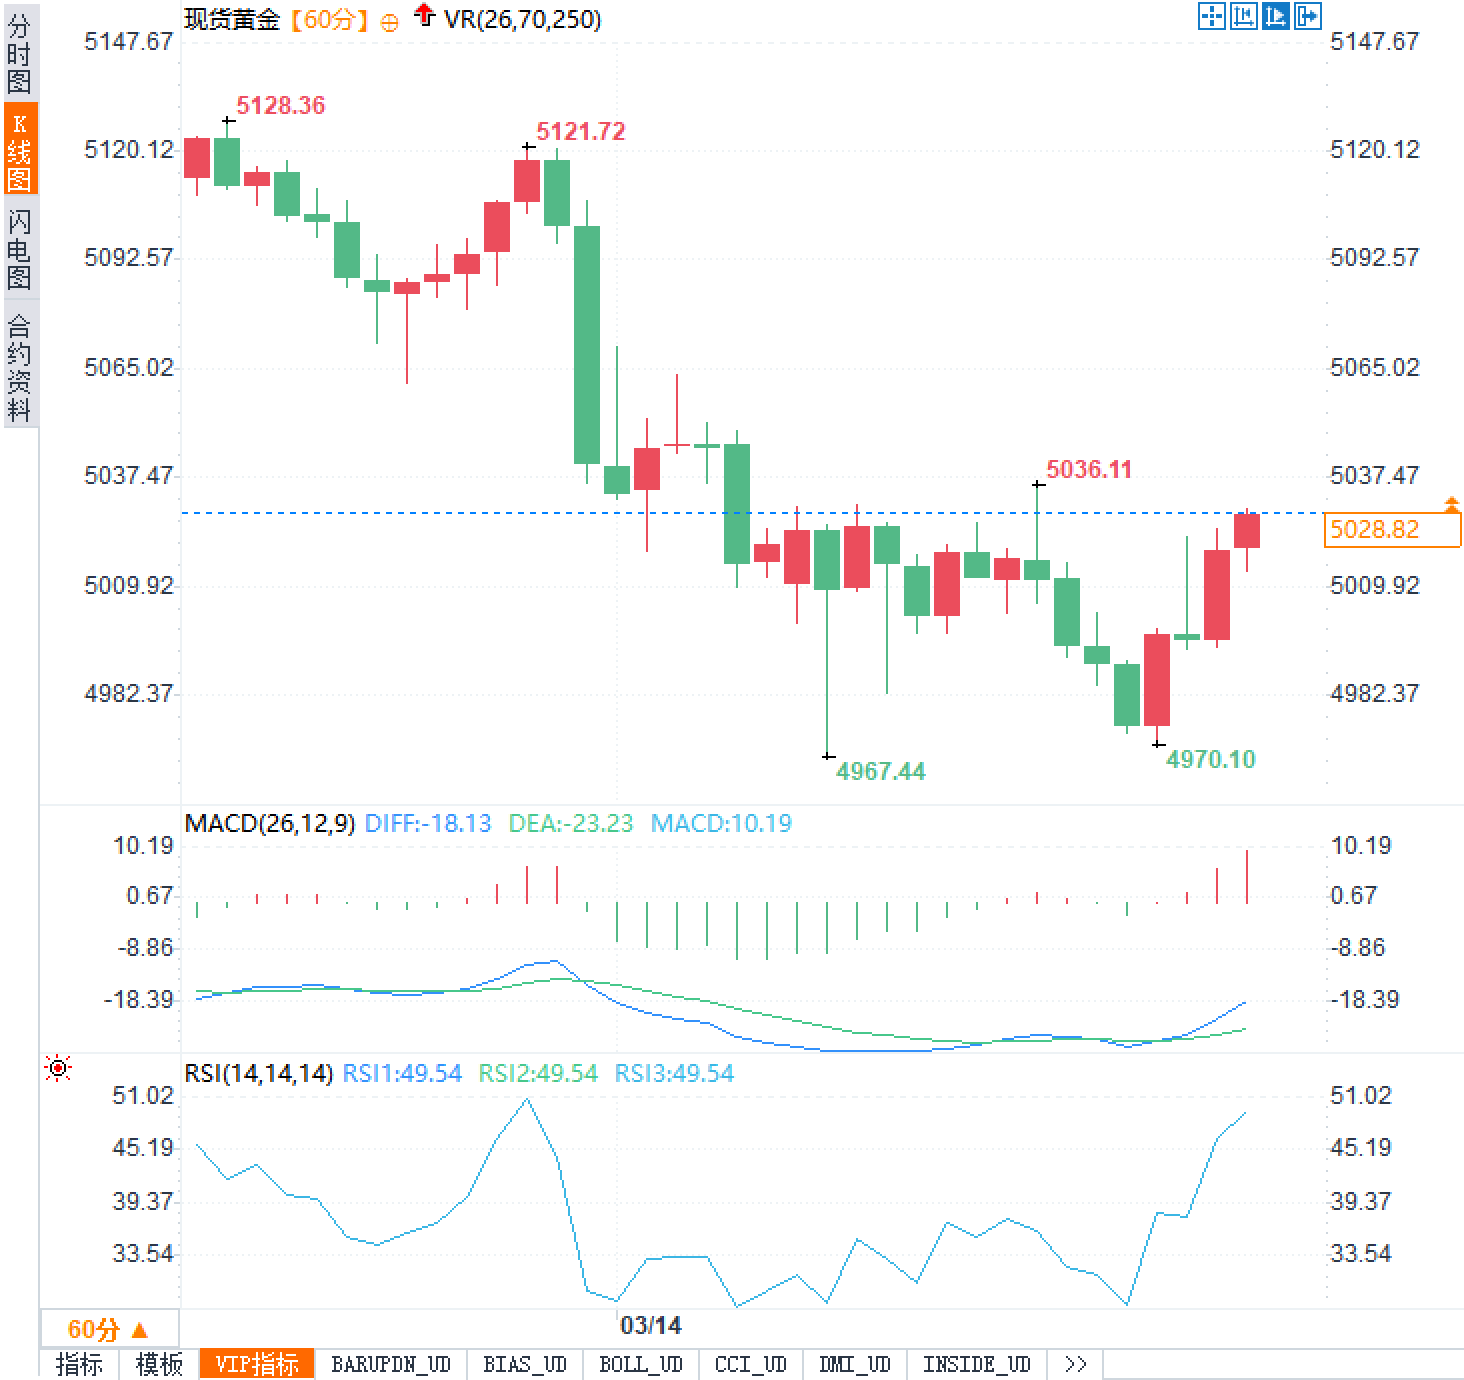
From a technical perspective, the $5,000 level has become a key support. A decisive break below this level could open up further downside potential, targeting the $4,800-$4,900 range. Conversely, if it holds and geopolitical risks escalate again, gold prices could potentially return above $5,100. However, current positioning data shows a significant decline in speculative net long positions, with CTA trend followers reducing their holdings noticeably, indicating a weak short-term directional bias.
Geopolitical conflicts drive up energy prices, and inflation expectations reshape the monetary policy framework.
The Middle East situation entered its third week, with no signs of de-escalation in the US-Iran conflict. The US launched airstrikes on key Iranian military facilities on islands, and Trump publicly warned that if Iran interfered with shipping in the Strait of Hormuz, the US might take further action against its oil infrastructure. He also called on the UK, France, Japan, South Korea, and other countries to send warships to safeguard the waterway. Iranian Foreign Minister Araqchi responded that the strait is only closed to "enemies and their supporters." These statements have exacerbated market concerns about disruptions to the global energy supply chain.
Brent crude oil is currently priced at around $102 per barrel, up about 45%-50% from pre-conflict levels; WTI crude oil is around $95 per barrel, with a similar increase. High energy costs are being passed on to consumers, pushing up core inflationary pressures. The market is beginning to reassess the reaction functions of major central banks: if high oil prices persist, it could lead to increased stagflation risks, forcing policymakers to maintain higher interest rates for a longer period.
With the Federal Reserve's March interest rate meeting approaching, the market expects a very high probability that the target range of 3.50%-3.75% will remain unchanged. The CME FedWatch tool shows that the probability of a 25 basis point rate cut in June has fallen significantly to a low level, and the expected number of rate cuts for the whole year has been compressed from two to about one. The European Central Bank, the Bank of England, the Bank of Japan, and the Bank of Canada are also likely to hold rates steady this week, while the Reserve Bank of Australia may raise rates again. This consensus of "higher interest rates for longer" directly suppresses the attractiveness of gold, a non-interest-bearing asset.
Gold is under technical pressure; the $5,000 level has become a watershed between bulls and bears.
Spot gold is currently trading around $5,020 per ounce, having dipped as low as $4,967 per ounce during the session, a three-week low. A retreat in the US dollar provided some support, but oil-driven inflation expectations dominated market sentiment, limiting the upside potential for gold prices.
From a technical perspective, the $5,000 level has become a key support. A decisive break below this level could open up further downside potential, targeting the $4,800-$4,900 range. Conversely, if it holds and geopolitical risks escalate again, gold prices could potentially return above $5,100. However, current positioning data shows a significant decline in speculative net long positions, with CTA trend followers reducing their holdings noticeably, indicating a weak short-term directional bias.
| index | Current level | Changes from before the conflict | Key observation points |
|---|---|---|---|
| spot gold | Approximately $5,020 per ounce | Narrow range trading | $5,000 support |
| US Dollar Index | Retreat from the high point | Minor adjustments | Federal Reserve guidance |
| Brent crude oil | Approximately $102 per barrel | Up 45%-50% | Strait of Hormuz Dynamics |
| Probability of a 25bp rate cut by the Federal Reserve in June | lower level | A sharp drop from 51% | Dot matrix update |
Frequently Asked Questions
Question 1: Why did gold prices fail to break through $5,000 despite the escalating conflict?
A: While geopolitical risks are driving demand for safe-haven assets, inflation expectations triggered by soaring oil prices are dominating market logic. The Federal Reserve and other central banks are forced to maintain high interest rates for longer, increasing the opportunity cost of holding gold. Although the US dollar has slightly retreated, its overall strength, coupled with speculative long positions being reduced, is limiting the upward momentum of gold prices. Technically, the $5,000 level has been tested multiple times; a breakthrough would require stronger signals of a policy shift or a sharp escalation of conflict.
Question 2: What potential impact will the central bank decisions of several countries this week have on precious metals?
A: The Fed's guidance is the focus. If Powell downplays the impact of oil price inflation in his press conference and hints at further rate cuts this year, gold and silver may see a breather and rebound. Conversely, if he emphasizes the need to observe the lasting impact of energy prices on inflation and maintains a hawkish stance, precious metals will face increased pressure. If the RBA raises rates, it will reinforce the global high-interest-rate environment, putting additional pressure on non-interest-bearing assets. Overall, the dot plot and updated economic forecasts are more directional than a single interest rate decision.
- Risk Warning and Disclaimer
- The market involves risk, and trading may not be suitable for all investors. This article is for reference only and does not constitute personal investment advice, nor does it take into account certain users’ specific investment objectives, financial situation, or other needs. Any investment decisions made based on this information are at your own risk.