Copper inventories on the London Metal Exchange surged to their highest level since 2019, putting downward pressure on copper prices due to concerns about oversupply.
2026-03-17 17:19:09
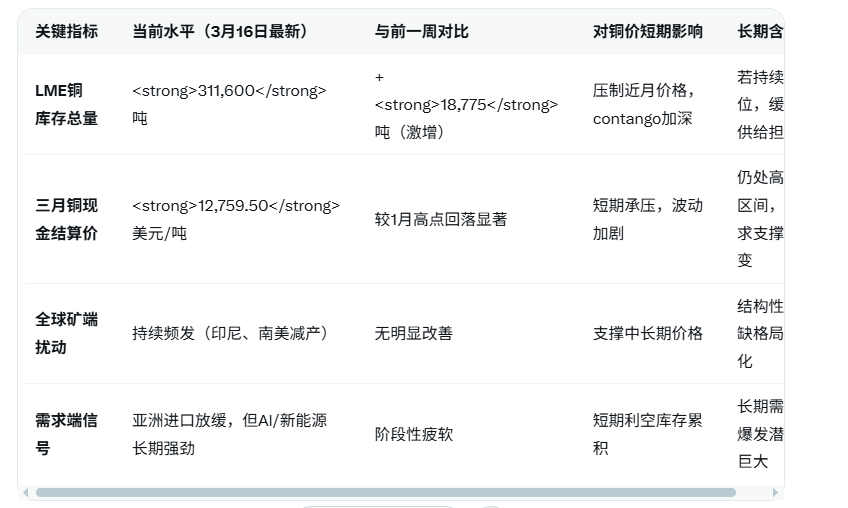
According to APP, the latest data released by the London Metal Exchange (LME) shows a significant increase in copper inventories, surging by 18,775 tons in a single week, reaching a new high since 2019. This surge is mainly due to large deliveries to warehouses in Asia and Europe, reflecting a significant increase in supply-side pressure in the market recently. Current LME copper inventories have exceeded 311,600 tons (as of the latest report on March 16), a significant increase from the previous week, raising concerns about short-term copper price trends. Although global copper demand remains strong, driven by AI, electric vehicles, and new energy infrastructure, the rapid accumulation of inventories may exacerbate the risk of narrowing spot premiums and a flattening futures curve.

Copper prices have recently shown mixed performance: LME three-month copper futures prices hovered around $ 12,759.50 /ton (cash settlement price on March 16), a significant drop from the historical high of $ 14,527.50 /ton reached in January. The surge in inventories directly reflects profit-taking by some producers and traders at high prices, while Asian demand has shown signs of temporary weakness (such as a slowdown in refined copper imports). However, the long-term structural supply shortage remains unchanged: frequent disruptions at global mines (such as the Grasberg mine landslide in Indonesia and production cuts at some South American mines), coupled with the explosive demand for copper from the new energy transition, have led most institutions to maintain their optimistic forecast of a copper price center of $ 10,500- $ 11,000 /ton in 2026.
The current surge in inventories is driven by a complex backdrop: on the one hand, high copper prices have spurred traders' and smelters' willingness to deliver goods; on the other hand, geopolitical risks and rising energy costs have slowed downstream consumption, creating a short-term supply-demand mismatch. Market analysts point out that if inventories continue to accumulate rapidly, it could deepen the contango structure (forward contracts trading at a premium), further suppressing near-month prices. However, if demand recovers subsequently (such as accelerated infrastructure and AI-related investments in Asia), the high inventory levels may signal that the negative factors have been fully priced in.
Overall, while the recent surge in LME copper inventories has reached a new high since 2019, putting significant pressure on copper prices in the short term, it may push the market into a period of high-level fluctuations or a correction. However, as the "king of industrial metals," copper's long-term supply-demand gap (driven by the transformation to new energy sources) is still considered a core support by most institutions. Investors need to closely monitor subsequent inventory trends, Asian refined copper import data, and global mine supply dynamics to determine whether this inventory inflection point is merely a short-term disturbance or the beginning of a signal of weakening demand.
Editor's Summary:
LME copper inventories surged by 18,775 tons in a single week, reaching a new high since 2019, reflecting increased supply and a temporary slowdown in demand at high prices. This puts downward pressure on copper prices in the short term and may exacerbate the contango structure. However, the global structural supply shortage and long-term support from new energy demand remain unchanged, and the market remains relatively optimistic about the central level of copper prices. It is necessary to be wary of whether the inventory trend will continue to accumulate.
Frequently Asked Questions
1. Why did LME copper inventories suddenly surge by 18,775 tons, reaching a new high since 2019?
This surge was primarily driven by large-scale deliveries to warehouses in Asia and Europe. High copper prices (previously reaching a record high of $ 14,527.50 per tonne) prompted traders, producers, and smelters to take profits, delivering physical copper to LME-registered warehouses. Simultaneously, a temporary slowdown in some downstream consumption (such as refined copper imports from Asia) led to an accumulation of physical copper in warehouses, creating a short-term supply-demand mismatch. Total inventories rose to 311,600 tons, disrupting the previous relatively tight balance.
2. What direct impact does the surge in inventories have on copper prices?
This poses a clear bearish factor in the short term. Rapidly rising inventories often lead to a narrowing of the spot premium, a flattening of the futures curve, or even a shift to contango (forward premium), putting downward pressure on near-month contract prices. Copper prices have already retreated from their January highs, with LME three-month copper currently fluctuating around $ 12,759.50 per tonne. If inventories continue to accumulate, it could trigger further corrections and increased volatility. However, if subsequent deliveries slow or demand recovers, the situation could potentially turn into a "sell-the-news" scenario.
3. Has the long-term supply and demand pattern of copper changed due to the increase in inventory?
The fundamental situation remains unchanged. Global copper mining disruptions persist (such as the Grasberg mine accident in Indonesia and production cuts at South American mines), with new capacity releases proceeding slowly. Meanwhile, demand is driven by AI data centers, electric vehicles, grid upgrades, and the transition to new energy sources, suggesting that a long-term structural shortage is expected to continue. Most institutions (such as Goldman Sachs) predict that copper prices will range between $ 10,500 and $ 11,000 per ton in 2026, and high inventory levels are largely seen as a short-term phenomenon.
4. What stage is the current copper price at? Why hasn't the market collapsed despite high inventory levels?
Copper prices are currently in a high-level consolidation and correction phase: having retreated from historical highs, they remain in a strong range above $ 12,000 /ton. The absence of a collapse is primarily due to strong long-term demand expectations (explosive growth in copper consumption driven by AI and new energy sources), coupled with rigid supply constraints at the mining end, leading to a high market tolerance for inventory accumulation. However, if inventories continue to rise rapidly and there are no clear signs of demand recovery, the risk of a correction will increase significantly.
5. How should investors view and respond to this surge in inventory?
Short-term caution is advised: Monitor whether inventories continue to accumulate. If next week's data shows a significant increase, copper prices will face greater downward pressure. Conversely, a slowdown in deliveries or improved demand signals could present a rebound opportunity. In the long term, the structural upward trend in copper prices remains positive. Key indicators to monitor include LME weekly inventory reports, Asian refined copper import data, global mining disruptions, and the progress of new energy investment to determine inflection points.
- Risk Warning and Disclaimer
- The market involves risk, and trading may not be suitable for all investors. This article is for reference only and does not constitute personal investment advice, nor does it take into account certain users’ specific investment objectives, financial situation, or other needs. Any investment decisions made based on this information are at your own risk.