Technical Analysis of Spot Gold on March 19: A Surge Followed by a One-Sided Decline
2026-03-19 20:15:32
On Thursday (March 19th) during the European session, gold maintained a narrow range with a slight upward bias in the early morning, fluctuating between 4830 and 4850. In the afternoon, the market turned downwards, with prices gradually breaking below the average price line, subsequently initiating a rapid, one-sided decline. The drop widened further, reaching around 4632.50, with an intraday decline of nearly 3.7%, indicating a concentrated release of bearish momentum.

4-hour technical analysis
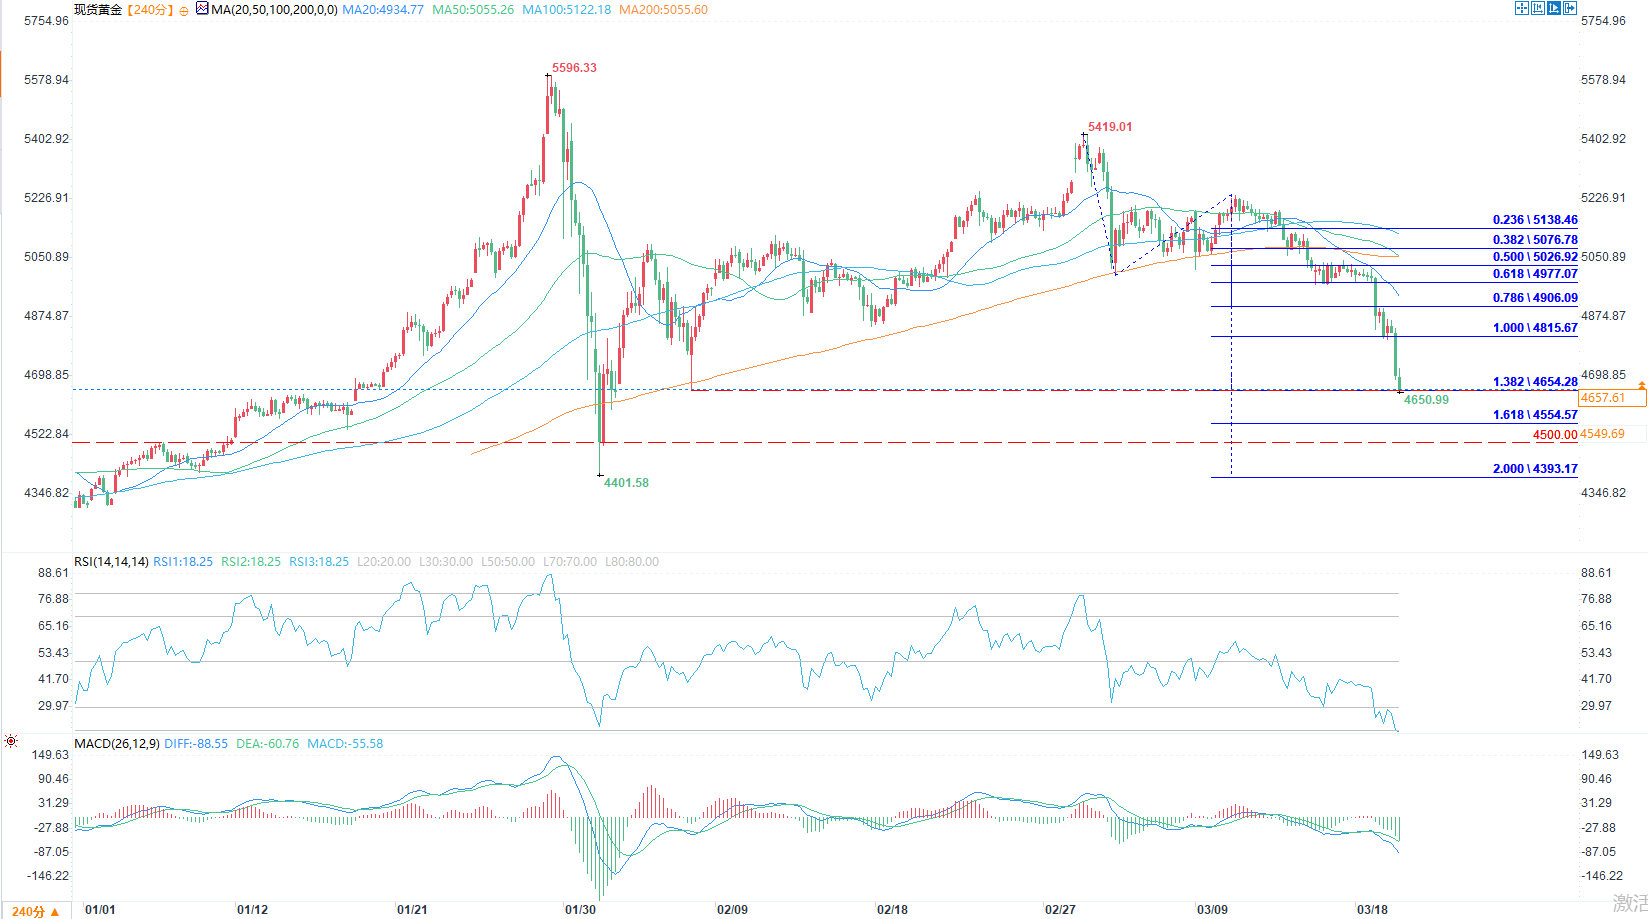
From a trend structure perspective, the short-term moving averages MA20 and MA50 have crossed below the long-term moving averages MA100 and MA200, forming a typical bearish pattern. The price has also effectively broken through all moving average support levels, which means that the medium-term downtrend has been established, and the current market is completely dominated by bearish forces.
In applying the Fibonacci extension scale, this analysis uses the previous low of 4401.58 as the starting point and the previous high of 5419.01 as the ending point to draw the extension scale. Currently, the price has broken below the 100% extension level of 4815.67 and is testing support near the 1.382 extension level of 4654. If this level is breached, the next support levels to watch are the 1.618 extension level of 4554.57 and the 2.000 extension level of 4393.17. Meanwhile, 4500, as a significant psychological level, will also provide some support. On the rebound side, the first resistance is the 100% extension level of 4815.67. If this level is broken, the next target is the 0.786 retracement level of 4906.09. If the rebound fails to hold above 4815, the downtrend will continue.
(4-hour chart of spot gold source: EasyForex)
In terms of indicators, the current value of RSI (14) is 18.26, which is in a severely oversold range. This provides potential momentum for a short-term technical rebound, but the indicator has not yet shown a clear signal of turning upward, and the strength of the rebound is still questionable. As for MACD, although the green bars have shown signs of shortening slightly, the DIFF line is still running below the DEA line, and the bearish momentum is still being released. It can only be judged that the decline may slow down in stages, and there is no trend reversal signal.
Going forward, we need to pay close attention to the effectiveness of the support level in the 4650-4654 range, and whether the RSI and MACD will form a resonance rebound signal. If the rebound fails to break through 4815, the downside potential will be further opened up.
4-hour technical analysis
From a trend structure perspective, the short-term moving averages MA20 and MA50 have crossed below the long-term moving averages MA100 and MA200, forming a typical bearish pattern. The price has also effectively broken through all moving average support levels, which means that the medium-term downtrend has been established, and the current market is completely dominated by bearish forces.
In applying the Fibonacci extension scale, this analysis uses the previous low of 4401.58 as the starting point and the previous high of 5419.01 as the ending point to draw the extension scale. Currently, the price has broken below the 100% extension level of 4815.67 and is testing support near the 1.382 extension level of 4654. If this level is breached, the next support levels to watch are the 1.618 extension level of 4554.57 and the 2.000 extension level of 4393.17. Meanwhile, 4500, as a significant psychological level, will also provide some support. On the rebound side, the first resistance is the 100% extension level of 4815.67. If this level is broken, the next target is the 0.786 retracement level of 4906.09. If the rebound fails to hold above 4815, the downtrend will continue.
(4-hour chart of spot gold source: EasyForex)
In terms of indicators, the current value of RSI (14) is 18.26, which is in a severely oversold range. This provides potential momentum for a short-term technical rebound, but the indicator has not yet shown a clear signal of turning upward, and the strength of the rebound is still questionable. As for MACD, although the green bars have shown signs of shortening slightly, the DIFF line is still running below the DEA line, and the bearish momentum is still being released. It can only be judged that the decline may slow down in stages, and there is no trend reversal signal.
Going forward, we need to pay close attention to the effectiveness of the support level in the 4650-4654 range, and whether the RSI and MACD will form a resonance rebound signal. If the rebound fails to break through 4815, the downside potential will be further opened up.
- Risk Warning and Disclaimer
- The market involves risk, and trading may not be suitable for all investors. This article is for reference only and does not constitute personal investment advice, nor does it take into account certain users’ specific investment objectives, financial situation, or other needs. Any investment decisions made based on this information are at your own risk.