The price just touched the 160 mark before plummeting! Did the Bank of Japan secretly intervene?
2026-03-30 20:56:49
On Monday (March 30), global financial markets fluctuated wildly amid geopolitical turmoil and inflation concerns. The USD/JPY pair initially broke through the key psychological and policy level of 160.00 in early trading, reaching a high of 160.456 , a new high in nearly 20 months. However, as the exchange rate hit its highs, market fears of potential intervention by Japanese authorities quickly intensified, triggering significant profit-taking and safe-haven selling.
In the bond market, the 10-year Japanese government bond yield surged to 2.39% in early trading, reaching its highest level since 1999, reflecting extreme market concerns about imported inflation triggered by the yen's depreciation. Meanwhile, escalating risks in Red Sea shipping in the Middle East led to a continued rise in oil prices, and the global bond market is experiencing its worst monthly decline in years. Although US Treasury yields retreated slightly earlier today due to risk aversion, the overall expectation of "high interest rates lasting longer" continues to support the US dollar. As of press time, the USD/JPY exchange rate was 159.457 , a daily decline of 0.50% , with significantly increased intraday volatility.
From a macroeconomic perspective, the current yen's exchange rate has entered an "intervention alert zone." The prevailing market view is that with the continued strengthening of the US dollar, conditions for joint US-Japan intervention are maturing. An analyst from a well-known institution pointed out that the G7 meeting this Monday may provide an opportunity for Japanese Finance Minister Satsuki Katayama to garner international support. It is worth noting that statements from Federal Reserve officials and the upcoming Dallas Fed manufacturing data will further determine the short-term direction of US Treasury yields, thus indirectly affecting the US-Japan exchange rate differential.
1. Bond Market Driving Logic:
The Japanese government bond yield curve exhibited a pronounced bearish steepening today. The 40-year JGB yield surged 10 basis points , while the sell-off in ultra-long-term bonds reflected the market's strong expectation of a 25 basis point rate hike by the Bank of Japan (BoJ) in April (currently priced in by the OIS market at approximately 70% ). However, due to the sharp decline in the stock market (the Nikkei index fell by more than 5% in early trading), some safe-haven funds flowed into short- to medium-term JGBs, causing the 10-year JGB yield to fall back to 2.355% after hitting a high.
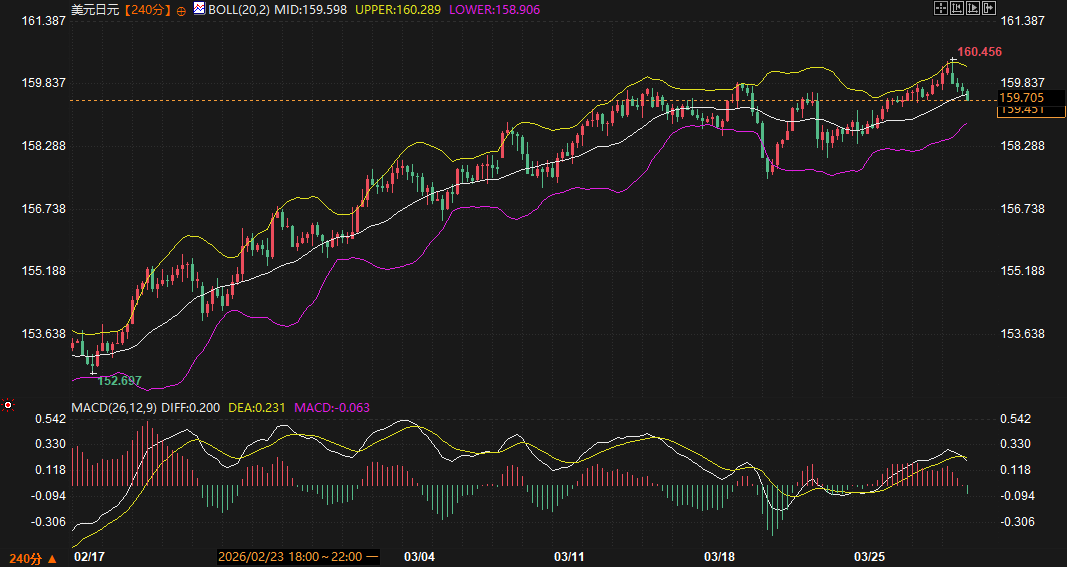
2. Technical Analysis (240-minute timeframe):
From a technical perspective, the rapid decline in USD/JPY after reaching 160.456 exhibits typical characteristics of a short-term top.
Bollinger Bands (BOLL): The price has now broken below the middle band at 159.598 . Based on technical momentum, if it cannot recover this level in the short term, the price will further seek support at the lower Bollinger Band at 158.906 .
MACD indicator: On the 4-hour chart, the DIF line and DEA line have formed a death cross , and the red momentum bars have turned green. This indicates that bearish momentum is being released, and there is significant short-term downward pressure.
Support and resistance range prediction:
Reference Contract: USD/JPY Spot
Resistance range: 160.300 - 160.500 (recent high and upper Bollinger Band resistance).
Support range: 158.900 - 159.400 (lower Bollinger Band and previous consolidation range).
Key points to watch during the session: the extent of verbal intervention by Japanese officials regarding exchange rate fluctuations, and the performance of the 10-year US Treasury yield in the 4.37% - 4.42% range.
In the short term, the USD/JPY pair is expected to remain in a high-level consolidation and pullback pattern. While the rise in Japanese government bond yields is theoretically beneficial to the yen, concerns about "stagflation" stemming from oil prices remaining above $100 have offset some of the positive impact. In the coming trading days, the market will be closely watching whether the Bank of Japan will actively support the yen by tapering its bond purchases or clarifying its interest rate hike path. If the exchange rate attempts to break above 160.50 again, caution must be exercised regarding potential intervention by the Japanese Ministry of Finance to sell dollars.
1. Why is the yen still facing depreciation pressure despite Japanese bond yields hitting a 27-year high?
Despite rising Japanese government bond yields, their absolute levels remain significantly lower than those of US Treasury bonds. More importantly, the recent surge in oil prices has exacerbated Japan's trade deficit pressures as an energy importer. Furthermore, while the market anticipates a rate hike by the Bank of Japan in April, this hawkish expectation has already been partially priced in, and geopolitical safe-haven flows into the US dollar continue to limit the relative attractiveness of the yen.
2. What is the difference between "joint intervention" and Japan's unilateral intervention?
Solo interventions typically involve the Japanese Ministry of Finance instructing the Bank of Japan to sell dollars and buy yen in the open market, and their effects are often short-lived. Joint interventions, on the other hand, involve coordinated action by major economies such as the US Treasury, sending a strong signal of policy consistency to the market and usually possessing a more lasting deterrent effect and the power to change trends. Currently, with the dollar appreciating, the external environment for coordinated intervention is more favorable than before.
3. How does a surge in oil prices transmit through the bond market and affect exchange rates?
High oil prices have fueled inflation expectations, leading to rising yields in major global bond markets (and consequently, falling prices). For Japan, rising oil prices not only bring imported inflation but may also dampen economic growth (demand destruction). This risk of stagflation makes it difficult for the Bank of Japan to make decisions on interest rate hikes. If the pace of interest rate increases fails to keep up with inflation expectations, the yen exchange rate will continue to be under pressure.
4. What does a MACD death cross on a 4-hour chart mean for short-term price movements?
In technical analysis, a MACD death cross on the 4-hour chart typically signifies the exhaustion of short- to medium-term upward momentum. Combined with the price breaking below the Bollinger Band's middle line, this suggests the market has entered a technical correction phase. If the DIF line further falls below the zero line, it means the price may have evolved from a "pullback after an upward move" into a "temporary trend reversal."
5. Why did US Treasury yields rebound (fall) when oil prices surged?
This reflects the market's "demand destruction" logic. When crude oil prices threatened to break through $120-150 , investors began to worry that extremely high energy costs would destroy economic growth, thus turning to US Treasuries as a safe haven. Furthermore, the significant decline in US Treasuries in the preceding period attracted buying support from long-term value investors, and short covering also pushed down short-term yields.
In the bond market, the 10-year Japanese government bond yield surged to 2.39% in early trading, reaching its highest level since 1999, reflecting extreme market concerns about imported inflation triggered by the yen's depreciation. Meanwhile, escalating risks in Red Sea shipping in the Middle East led to a continued rise in oil prices, and the global bond market is experiencing its worst monthly decline in years. Although US Treasury yields retreated slightly earlier today due to risk aversion, the overall expectation of "high interest rates lasting longer" continues to support the US dollar. As of press time, the USD/JPY exchange rate was 159.457 , a daily decline of 0.50% , with significantly increased intraday volatility.
In-depth analysis of fundamentals and technical aspects
From a macroeconomic perspective, the current yen's exchange rate has entered an "intervention alert zone." The prevailing market view is that with the continued strengthening of the US dollar, conditions for joint US-Japan intervention are maturing. An analyst from a well-known institution pointed out that the G7 meeting this Monday may provide an opportunity for Japanese Finance Minister Satsuki Katayama to garner international support. It is worth noting that statements from Federal Reserve officials and the upcoming Dallas Fed manufacturing data will further determine the short-term direction of US Treasury yields, thus indirectly affecting the US-Japan exchange rate differential.
1. Bond Market Driving Logic:
The Japanese government bond yield curve exhibited a pronounced bearish steepening today. The 40-year JGB yield surged 10 basis points , while the sell-off in ultra-long-term bonds reflected the market's strong expectation of a 25 basis point rate hike by the Bank of Japan (BoJ) in April (currently priced in by the OIS market at approximately 70% ). However, due to the sharp decline in the stock market (the Nikkei index fell by more than 5% in early trading), some safe-haven funds flowed into short- to medium-term JGBs, causing the 10-year JGB yield to fall back to 2.355% after hitting a high.
2. Technical Analysis (240-minute timeframe):
From a technical perspective, the rapid decline in USD/JPY after reaching 160.456 exhibits typical characteristics of a short-term top.
Bollinger Bands (BOLL): The price has now broken below the middle band at 159.598 . Based on technical momentum, if it cannot recover this level in the short term, the price will further seek support at the lower Bollinger Band at 158.906 .
MACD indicator: On the 4-hour chart, the DIF line and DEA line have formed a death cross , and the red momentum bars have turned green. This indicates that bearish momentum is being released, and there is significant short-term downward pressure.
Support and resistance range prediction:
Reference Contract: USD/JPY Spot
Resistance range: 160.300 - 160.500 (recent high and upper Bollinger Band resistance).
Support range: 158.900 - 159.400 (lower Bollinger Band and previous consolidation range).
Key points to watch during the session: the extent of verbal intervention by Japanese officials regarding exchange rate fluctuations, and the performance of the 10-year US Treasury yield in the 4.37% - 4.42% range.
Future Trend Outlook
In the short term, the USD/JPY pair is expected to remain in a high-level consolidation and pullback pattern. While the rise in Japanese government bond yields is theoretically beneficial to the yen, concerns about "stagflation" stemming from oil prices remaining above $100 have offset some of the positive impact. In the coming trading days, the market will be closely watching whether the Bank of Japan will actively support the yen by tapering its bond purchases or clarifying its interest rate hike path. If the exchange rate attempts to break above 160.50 again, caution must be exercised regarding potential intervention by the Japanese Ministry of Finance to sell dollars.
Frequently Asked Questions
1. Why is the yen still facing depreciation pressure despite Japanese bond yields hitting a 27-year high?
Despite rising Japanese government bond yields, their absolute levels remain significantly lower than those of US Treasury bonds. More importantly, the recent surge in oil prices has exacerbated Japan's trade deficit pressures as an energy importer. Furthermore, while the market anticipates a rate hike by the Bank of Japan in April, this hawkish expectation has already been partially priced in, and geopolitical safe-haven flows into the US dollar continue to limit the relative attractiveness of the yen.
2. What is the difference between "joint intervention" and Japan's unilateral intervention?
Solo interventions typically involve the Japanese Ministry of Finance instructing the Bank of Japan to sell dollars and buy yen in the open market, and their effects are often short-lived. Joint interventions, on the other hand, involve coordinated action by major economies such as the US Treasury, sending a strong signal of policy consistency to the market and usually possessing a more lasting deterrent effect and the power to change trends. Currently, with the dollar appreciating, the external environment for coordinated intervention is more favorable than before.
3. How does a surge in oil prices transmit through the bond market and affect exchange rates?
High oil prices have fueled inflation expectations, leading to rising yields in major global bond markets (and consequently, falling prices). For Japan, rising oil prices not only bring imported inflation but may also dampen economic growth (demand destruction). This risk of stagflation makes it difficult for the Bank of Japan to make decisions on interest rate hikes. If the pace of interest rate increases fails to keep up with inflation expectations, the yen exchange rate will continue to be under pressure.
4. What does a MACD death cross on a 4-hour chart mean for short-term price movements?
In technical analysis, a MACD death cross on the 4-hour chart typically signifies the exhaustion of short- to medium-term upward momentum. Combined with the price breaking below the Bollinger Band's middle line, this suggests the market has entered a technical correction phase. If the DIF line further falls below the zero line, it means the price may have evolved from a "pullback after an upward move" into a "temporary trend reversal."
5. Why did US Treasury yields rebound (fall) when oil prices surged?
This reflects the market's "demand destruction" logic. When crude oil prices threatened to break through $120-150 , investors began to worry that extremely high energy costs would destroy economic growth, thus turning to US Treasuries as a safe haven. Furthermore, the significant decline in US Treasuries in the preceding period attracted buying support from long-term value investors, and short covering also pushed down short-term yields.
- Risk Warning and Disclaimer
- The market involves risk, and trading may not be suitable for all investors. This article is for reference only and does not constitute personal investment advice, nor does it take into account certain users’ specific investment objectives, financial situation, or other needs. Any investment decisions made based on this information are at your own risk.