After falling 15% from its high of 5419, is gold seeing a turnaround?
2026-03-30 21:24:45
On Monday, March 30th, spot gold prices touched a low of $4419 during the Asian session before quickly rebounding to around $4570. This movement occurred against the backdrop of a slight pullback in US Treasury yields from multi-month highs, a strong US dollar index, and a significant escalation of conflict risks in the Middle East, providing support for safe-haven assets. Traders are closely watching the potential drag on economic growth from high energy prices, as well as subtle shifts in expectations regarding the Federal Reserve's monetary policy.

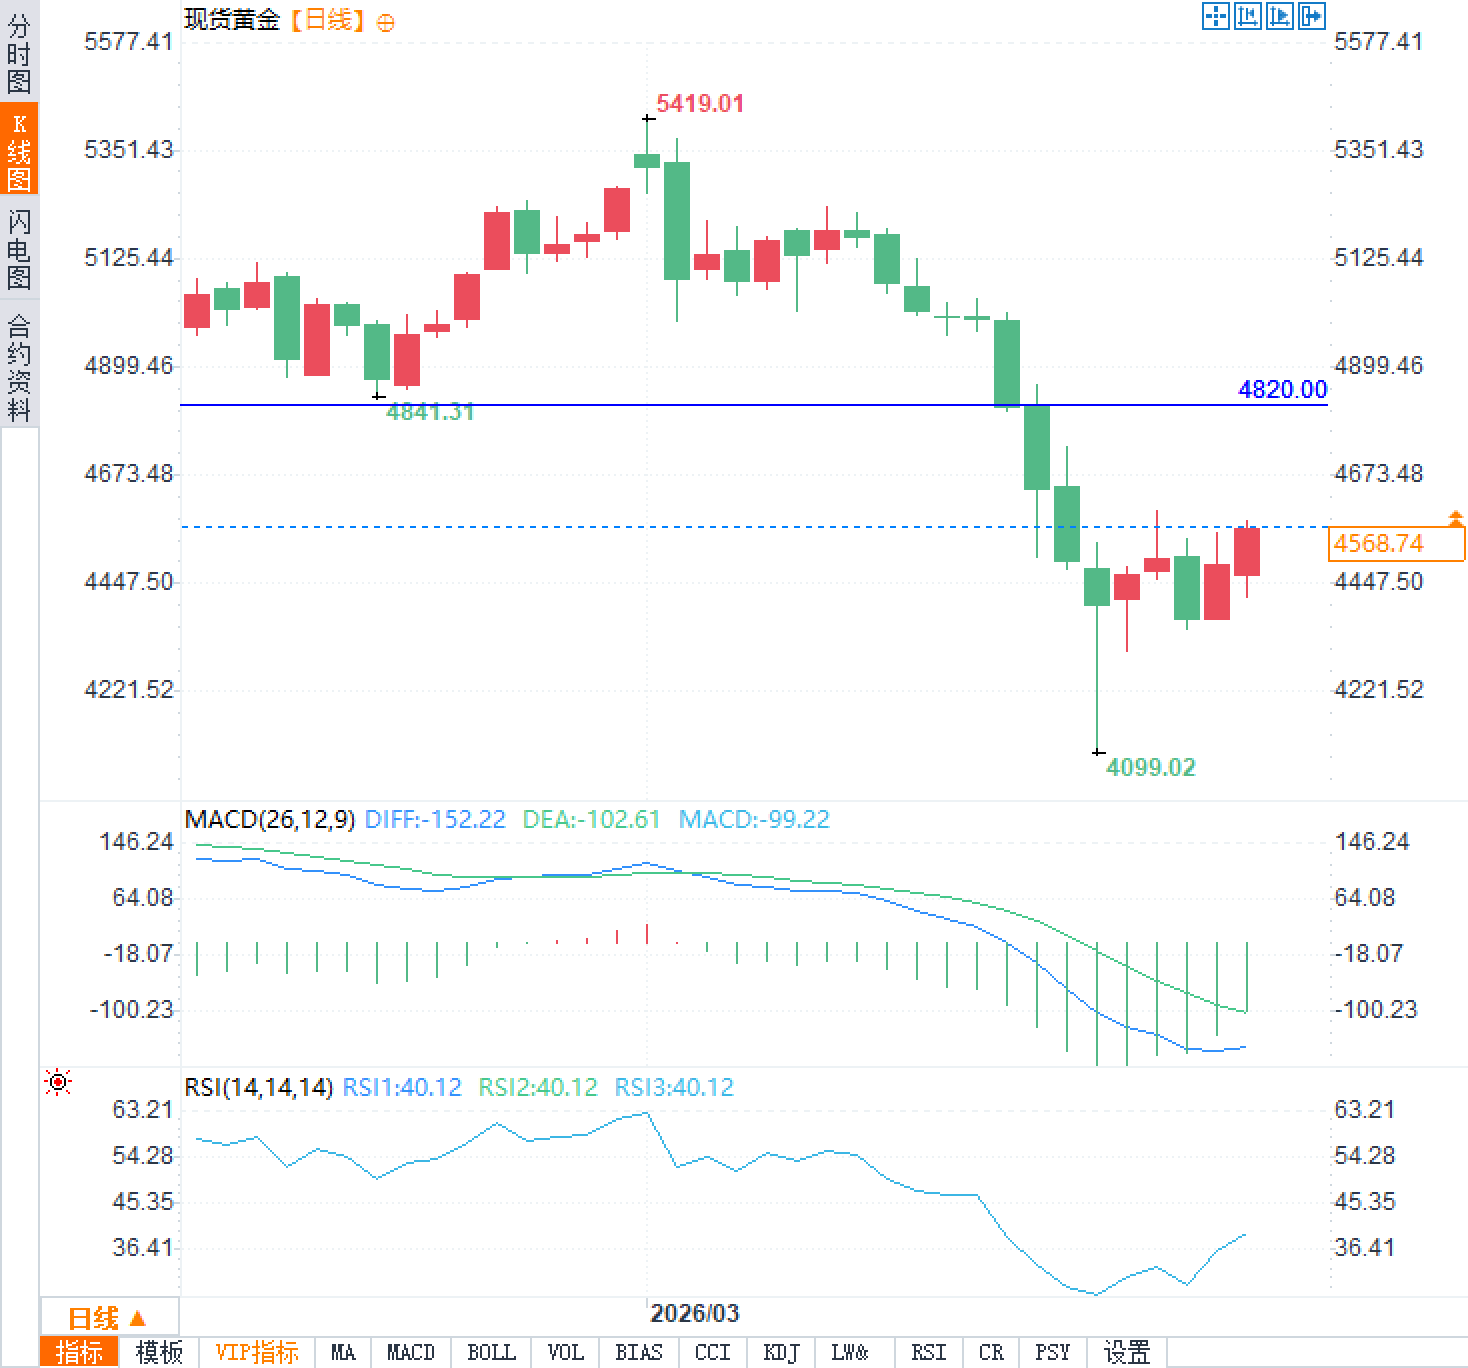
Spot gold reversed its earlier losses, finding significant support near the 200-day moving average, indicating a recovery in short-term buying momentum. While the dollar remains strong, a moderate decline in yields has provided some breathing room for gold prices. Data shows that gold touched a high of $5419 in March before falling nearly 15%, and this month it faces the end of a seven-month winning streak. This decline reflects the continued pressure of a high-interest-rate environment on non-yielding assets, but sudden geopolitical developments are altering the short-term supply and demand balance.
As a traditional safe-haven asset, gold's price sensitivity is shifting from a purely interest rate-driven path to a more complex risk-based pricing strategy. Latest quotes show spot gold trading within the $4,570 range, up more than 3% from its early-month low. While this rebound is limited, it highlights the market's demand for defensive asset allocation amid multiple uncertainties. Compared to the same period last year, current gold prices have risen by approximately 12%, but the pullback since March serves as a reminder to traders that external shocks could amplify volatility at any time.
While US Treasury yields have recently retreated from their highs, they remain at relatively high levels overall, significantly suppressing gold prices. The market had previously priced in a potential hawkish stance from the Federal Reserve due to rising energy prices, with traders initially anticipating a possible rate hike this year. However, as the negative impact of high oil prices on economic growth becomes increasingly apparent, the focus is shifting to growth risks. The latest CME FedWatch tool shows that the market generally expects the federal funds rate to remain in the 3.50%-3.75% range until the end of 2026, with only a very limited number of adjustments.
This policy path increases the opportunity cost of holding gold, as non-yielding assets struggle to compete with interest-bearing instruments in a high-interest-rate environment. The upcoming March manufacturing purchasing managers' index and non-farm payroll data this week will further test the resilience of economic growth. If the data is weaker than expected, yields may continue to be under pressure, providing additional support for gold; conversely, strong data may strengthen the dollar, limiting the upside potential for gold prices. Overall, the Fed's "higher and longer" interest rate framework continues to dominate pricing logic, and the structural weakness of gold is unlikely to reverse completely in the short term. However, any easing of yields could amplify the premium effect of geopolitical risks.
On the geopolitical front in the Middle East, the Houthi rebels joined the conflict last weekend, launching missile and drone attacks against Israel and opening a new front in the regional conflict. This event exacerbated the risk of disruptions to Red Sea shipping and oil transport through the Strait of Hormuz, directly pushing up global energy prices and injecting a significant safe-haven premium into gold. Reports also indicate that the United States is assessing military options regarding Iranian uranium facilities. The Pentagon is reportedly preparing for ground operations in the region and deploying thousands of additional troops.
These developments have fueled market concerns about a broader regional war, and traders are reassessing the potential impact of supply chain disruptions on global trade. Historically, similar geopolitical events have often driven up gold risk premiums, and this time is no exception, although a strong dollar provides some hedging. It is worth noting that while the escalation of the conflict did not immediately trigger a full-blown oil crisis, the increase in energy prices per barrel has been enough to affect global inflation expectations and indirectly weaken economic growth prospects.
From a technical perspective, spot gold has rebounded from near the 200-day moving average and is beginning to test the 100-day moving average resistance. Traders are watching the $4,570-$4,600 range as a key resistance level; a successful break above this level could open up further upside potential. Conversely, a drop below $4,400 could warrant caution as it may test even lower support levels.
Overall, current gold price movements remain driven by both monetary policy and geopolitical factors. In the short term, declining yields provide a buffer, while conflict risks amplify volatility.
Current dynamics and recent performance of gold prices
Spot gold reversed its earlier losses, finding significant support near the 200-day moving average, indicating a recovery in short-term buying momentum. While the dollar remains strong, a moderate decline in yields has provided some breathing room for gold prices. Data shows that gold touched a high of $5419 in March before falling nearly 15%, and this month it faces the end of a seven-month winning streak. This decline reflects the continued pressure of a high-interest-rate environment on non-yielding assets, but sudden geopolitical developments are altering the short-term supply and demand balance.
As a traditional safe-haven asset, gold's price sensitivity is shifting from a purely interest rate-driven path to a more complex risk-based pricing strategy. Latest quotes show spot gold trading within the $4,570 range, up more than 3% from its early-month low. While this rebound is limited, it highlights the market's demand for defensive asset allocation amid multiple uncertainties. Compared to the same period last year, current gold prices have risen by approximately 12%, but the pullback since March serves as a reminder to traders that external shocks could amplify volatility at any time.
Yield decline and Fed policy outlook
While US Treasury yields have recently retreated from their highs, they remain at relatively high levels overall, significantly suppressing gold prices. The market had previously priced in a potential hawkish stance from the Federal Reserve due to rising energy prices, with traders initially anticipating a possible rate hike this year. However, as the negative impact of high oil prices on economic growth becomes increasingly apparent, the focus is shifting to growth risks. The latest CME FedWatch tool shows that the market generally expects the federal funds rate to remain in the 3.50%-3.75% range until the end of 2026, with only a very limited number of adjustments.
This policy path increases the opportunity cost of holding gold, as non-yielding assets struggle to compete with interest-bearing instruments in a high-interest-rate environment. The upcoming March manufacturing purchasing managers' index and non-farm payroll data this week will further test the resilience of economic growth. If the data is weaker than expected, yields may continue to be under pressure, providing additional support for gold; conversely, strong data may strengthen the dollar, limiting the upside potential for gold prices. Overall, the Fed's "higher and longer" interest rate framework continues to dominate pricing logic, and the structural weakness of gold is unlikely to reverse completely in the short term. However, any easing of yields could amplify the premium effect of geopolitical risks.
Escalating Middle East conflict drives demand for safe-haven assets
On the geopolitical front in the Middle East, the Houthi rebels joined the conflict last weekend, launching missile and drone attacks against Israel and opening a new front in the regional conflict. This event exacerbated the risk of disruptions to Red Sea shipping and oil transport through the Strait of Hormuz, directly pushing up global energy prices and injecting a significant safe-haven premium into gold. Reports also indicate that the United States is assessing military options regarding Iranian uranium facilities. The Pentagon is reportedly preparing for ground operations in the region and deploying thousands of additional troops.
These developments have fueled market concerns about a broader regional war, and traders are reassessing the potential impact of supply chain disruptions on global trade. Historically, similar geopolitical events have often driven up gold risk premiums, and this time is no exception, although a strong dollar provides some hedging. It is worth noting that while the escalation of the conflict did not immediately trigger a full-blown oil crisis, the increase in energy prices per barrel has been enough to affect global inflation expectations and indirectly weaken economic growth prospects.
Technical Analysis and Short-Term Outlook
From a technical perspective, spot gold has rebounded from near the 200-day moving average and is beginning to test the 100-day moving average resistance. Traders are watching the $4,570-$4,600 range as a key resistance level; a successful break above this level could open up further upside potential. Conversely, a drop below $4,400 could warrant caution as it may test even lower support levels.
Overall, current gold price movements remain driven by both monetary policy and geopolitical factors. In the short term, declining yields provide a buffer, while conflict risks amplify volatility.
- Risk Warning and Disclaimer
- The market involves risk, and trading may not be suitable for all investors. This article is for reference only and does not constitute personal investment advice, nor does it take into account certain users’ specific investment objectives, financial situation, or other needs. Any investment decisions made based on this information are at your own risk.