Is there a hidden danger in this recent surge in gold prices?
2026-04-01 21:43:02
Gold prices extended gains on Wednesday, April 1st, trading near a two-week high. Spot gold was quoted at around $4735, having touched $4763 in early European trading, driven by optimism that the conflict between the US and Iran might ease quickly. This movement coincided with a decline in the US dollar index to around 99.4 and a pullback in oil prices from their highs, both boosting the performance of non-yielding assets. Overall market risk sentiment improved, but tensions in the Strait of Hormuz remain, coupled with the latest US economic data, prompting traders to focus on the transmission effects of geopolitical variables on inflation expectations and the path of monetary policy.
US President Trump stated that the US will soon leave Iran, and military action could end within two to three weeks, regardless of whether an agreement is reached. Iranian President Pesashyan, on Tuesday, indicated that the country has the necessary will to end the current conflict, but needs reliable guarantees that the war will not be repeated. These statements quickly improved risk appetite in financial markets, leading to a decline in oil prices, a weaker dollar, and a rebound in gold. However, tensions surrounding the Strait of Hormuz have not completely subsided, and oil prices remain high compared to pre-conflict levels, continuing to fuel market concerns about supply chain disruptions and reinforcing concerns about both inflationary pressures and slowing economic growth. For traders, this geopolitical dynamic directly impacts the correlation between commodities: while a decline in oil prices is a short-term boon for gold, if the Hormuz issue continues to drag on, rising energy costs will further push up global inflation expectations, thus limiting central bank easing options. Trump's recent social media posts mentioned that the Iranian president is seeking a ceasefire, but emphasized that the Strait of Hormuz must be open for free passage, otherwise he will continue to exert pressure.
The latest US economic indicators show that employment and consumption remain resilient. ADP private sector employment rose by 62,000 in March, exceeding market expectations of 40,000, with the previous figure revised to 66,000; retail sales rose 0.6% month-on-month in February, higher than the expected 0.5%, with the previous figure revised to -0.1%. These data have alleviated concerns about a slowdown in economic growth to some extent, but combined with geopolitical factors, they may exacerbate inflation expectations. The following is a comparison of key data:
According to the CME FedWatch tool, the market currently expects the Federal Reserve to maintain interest rates in the 3.50%-3.75% range until the end of 2026. If geopolitical tensions ease further and lead to a significant drop in oil prices, expectations for further easing may resurface. Trump will also deliver a national address on the Iran situation on Thursday; these events could trigger short-term volatility. Overall, given the coexistence of resilient economic data and geopolitical risks, the probability of the Fed maintaining a "higher and longer" interest rate path has increased. This directly raises the opportunity cost of holding gold, limiting the potential for continued bullish buying.
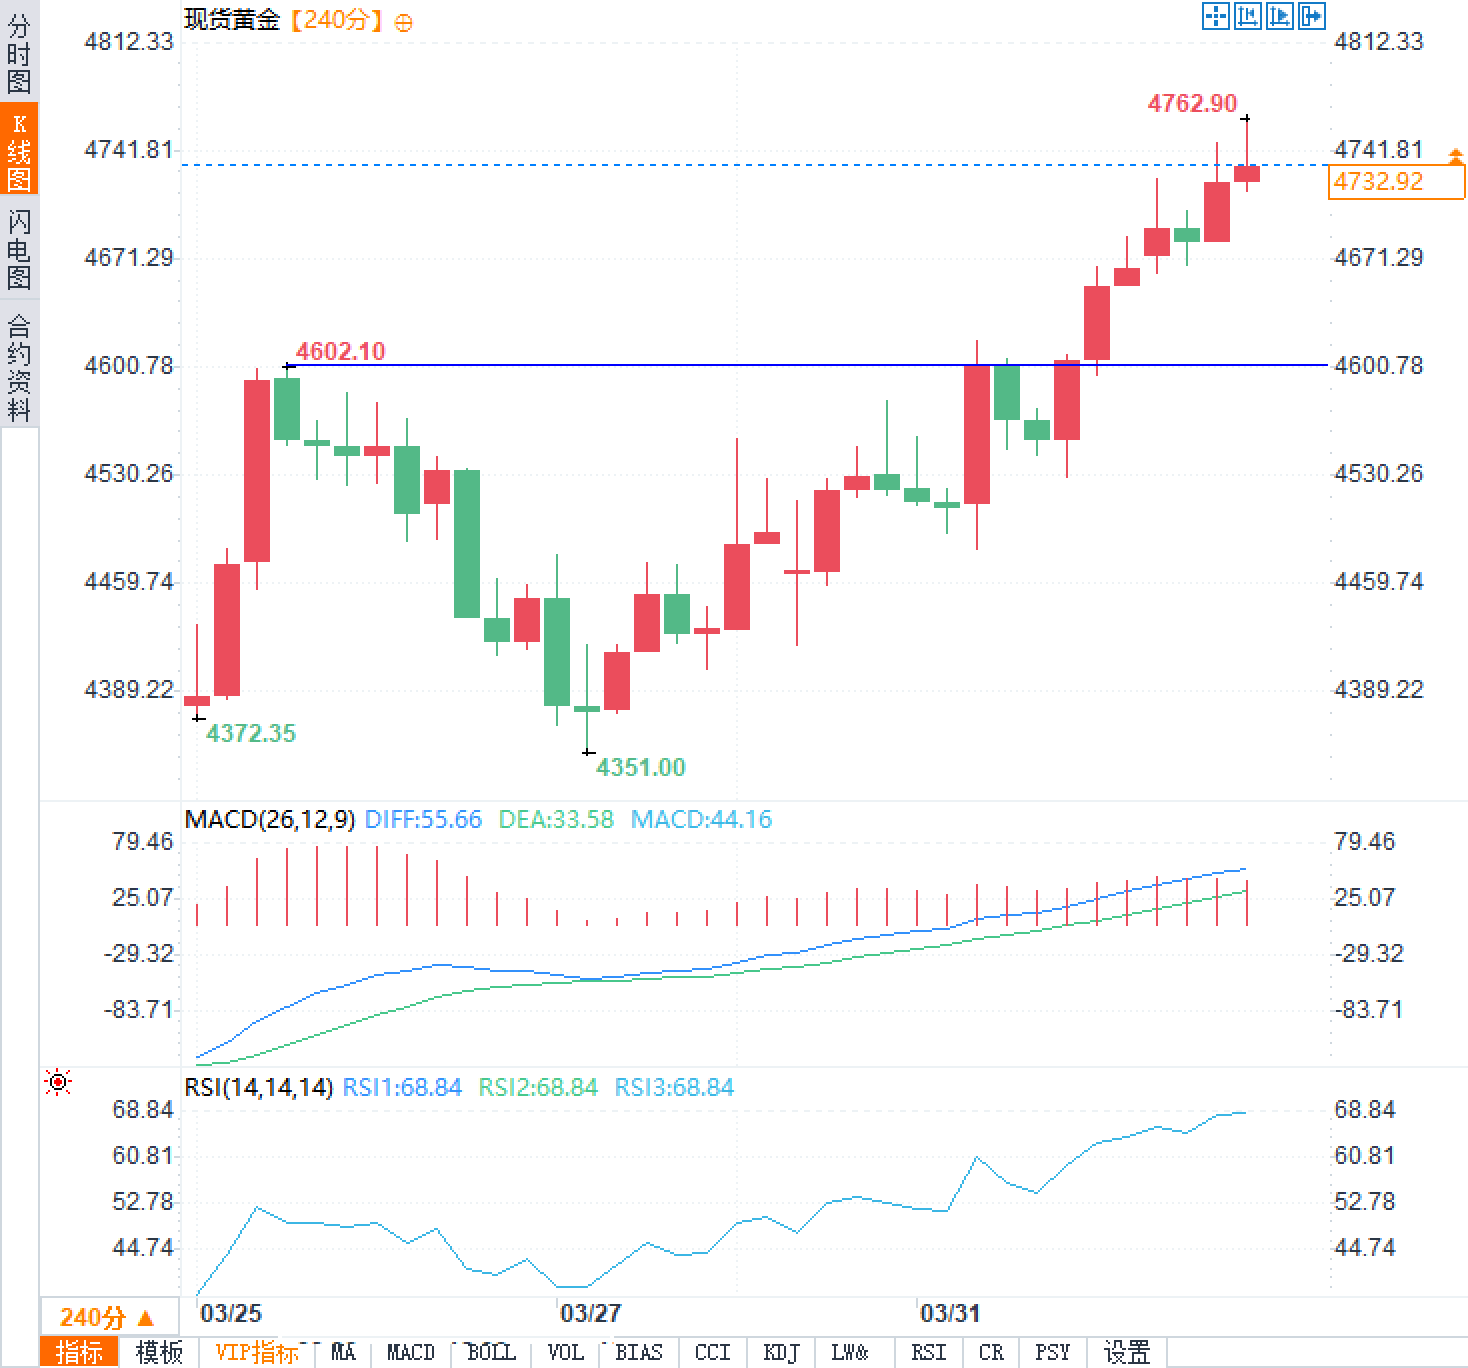
Observing the 4-hour chart, spot gold has effectively broken through the 50-period simple moving average, and the 100-period simple moving average has become the next key resistance level to watch. The current price is fluctuating around $4735, with the intraday high of $4763 indicating strong buying support. Against the backdrop of improved risk sentiment, a weaker dollar and a pullback in oil prices provide dual support; however, if there are setbacks in the Hormuz-related negotiations, safe-haven buying may strengthen again.
Geopolitical easing expectations are reshaping the pricing of safe-haven assets.
US President Trump stated that the US will soon leave Iran, and military action could end within two to three weeks, regardless of whether an agreement is reached. Iranian President Pesashyan, on Tuesday, indicated that the country has the necessary will to end the current conflict, but needs reliable guarantees that the war will not be repeated. These statements quickly improved risk appetite in financial markets, leading to a decline in oil prices, a weaker dollar, and a rebound in gold. However, tensions surrounding the Strait of Hormuz have not completely subsided, and oil prices remain high compared to pre-conflict levels, continuing to fuel market concerns about supply chain disruptions and reinforcing concerns about both inflationary pressures and slowing economic growth. For traders, this geopolitical dynamic directly impacts the correlation between commodities: while a decline in oil prices is a short-term boon for gold, if the Hormuz issue continues to drag on, rising energy costs will further push up global inflation expectations, thus limiting central bank easing options. Trump's recent social media posts mentioned that the Iranian president is seeking a ceasefire, but emphasized that the Strait of Hormuz must be open for free passage, otherwise he will continue to exert pressure.
Analysis of US Economic Data and Monetary Policy Path
The latest US economic indicators show that employment and consumption remain resilient. ADP private sector employment rose by 62,000 in March, exceeding market expectations of 40,000, with the previous figure revised to 66,000; retail sales rose 0.6% month-on-month in February, higher than the expected 0.5%, with the previous figure revised to -0.1%. These data have alleviated concerns about a slowdown in economic growth to some extent, but combined with geopolitical factors, they may exacerbate inflation expectations. The following is a comparison of key data:
| Economic indicators | Latest value | Market expectations | Previous value (corrected) |
|---|---|---|---|
| ADP Private Sector Employment Changes (March) | +62,000 | +40,000 | +66,000 |
| Retail sales month-on-month (February) | +0.6% | +0.5% | -0.1% |
According to the CME FedWatch tool, the market currently expects the Federal Reserve to maintain interest rates in the 3.50%-3.75% range until the end of 2026. If geopolitical tensions ease further and lead to a significant drop in oil prices, expectations for further easing may resurface. Trump will also deliver a national address on the Iran situation on Thursday; these events could trigger short-term volatility. Overall, given the coexistence of resilient economic data and geopolitical risks, the probability of the Fed maintaining a "higher and longer" interest rate path has increased. This directly raises the opportunity cost of holding gold, limiting the potential for continued bullish buying.
Technical signals highlight a short-term trend reversal
Observing the 4-hour chart, spot gold has effectively broken through the 50-period simple moving average, and the 100-period simple moving average has become the next key resistance level to watch. The current price is fluctuating around $4735, with the intraday high of $4763 indicating strong buying support. Against the backdrop of improved risk sentiment, a weaker dollar and a pullback in oil prices provide dual support; however, if there are setbacks in the Hormuz-related negotiations, safe-haven buying may strengthen again.
Frequently Asked Questions
Question 1: How do expectations of easing tensions between the US and Iran directly affect the pricing logic of gold?
A: Easing tensions reduced demand for safe-haven assets, leading to a decline in oil prices and a weaker dollar, creating a short-term bullish factor. However, continued tensions in the Strait of Hormuz continue to push up energy costs, indirectly strengthening inflation expectations and supporting the Fed's high-interest-rate path, limiting further significant upside potential for gold. Traders need to distinguish between short-term sentiment-driven factors and changes in medium- to long-term opportunity costs.
Question 2: What guidance does the latest US economic data provide for the Federal Reserve's interest rate path?
A: The better-than-expected ADP employment and retail sales figures indicate that the economy remains resilient. However, coupled with geopolitical inflation risks, the market maintains its expectation that the Federal Reserve will keep interest rates in the 3.50%-3.75% range until the end of 2026. If oil prices fall further due to easing, expectations for further easing may reignite. Currently, the CME FedWatch tool shows a dominant probability of stability, and traders are focusing on the degree of confirmation from Fed officials regarding the "higher and longer" strategy.
- Risk Warning and Disclaimer
- The market involves risk, and trading may not be suitable for all investors. This article is for reference only and does not constitute personal investment advice, nor does it take into account certain users’ specific investment objectives, financial situation, or other needs. Any investment decisions made based on this information are at your own risk.