Oil prices have become a hidden killer of gold; the market's biggest fear now is not war, but the curse of US debt.
2026-04-02 19:11:05
On Thursday (April 2nd), the market pricing logic saw a significant structural shift in the carriers of risk aversion. Influenced by the latest geopolitical developments and the tough rhetoric and actions of relevant leaders regarding Iran, the market's previous optimistic expectations for a peaceful resolution to the conflict faced a "reality check." On April 2nd, Beijing time, global financial markets experienced significant volatility, with fund flows exhibiting a clear hierarchy: the US dollar and US Treasury yields rose in tandem, while spot gold, after hitting a two-week high, suffered a sharp decline, falling by more than 4% at one point. This rare "internal divergence within safe-haven assets" is primarily due to the renewed high inflation expectations and the rapid fading of bets on Fed rate cuts. Currently, the US dollar , with its strong liquidity in volatile situations, has replaced gold as the market's preferred "safe haven."

Recent volatility in the US Treasury market has been a key driver of the dollar's strength. From a technical perspective, the 10-year US Treasury yield is currently at 4.369% , within a high-level consolidation range. Although it retreated in late March, it found strong support near the Bollinger Band middle line at 4.330 . The MACD indicator shows that the DIFF is about to cross above the DEA to form a golden cross , and the red bars are turning positive, indicating that the short-term downward momentum has largely exhausted itself, and bullish forces are accumulating.
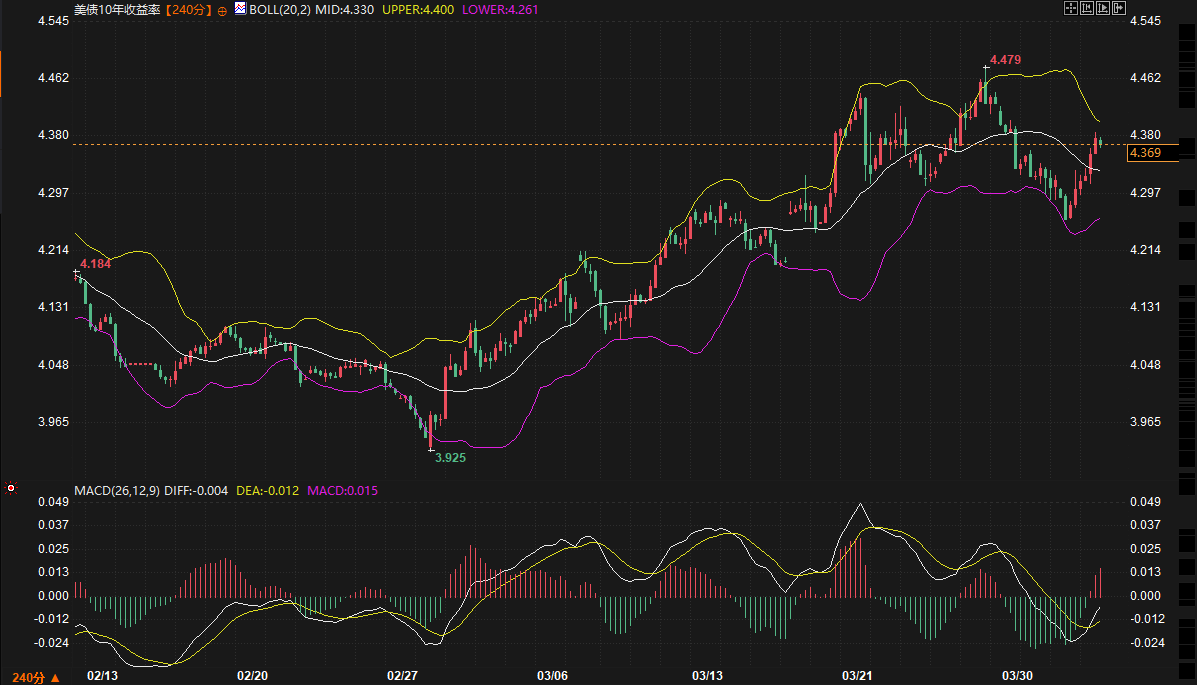
Fundamentally, the escalating external situation directly pushed up crude oil prices, with a single-day increase of about 7% exacerbating market fears of sticky inflation . A well-known institution's analysis points out that the inflationary pressure from rising oil prices will force the Federal Reserve to maintain high interest rates for a longer period. According to the latest data, market expectations for a December rate cut have dropped sharply from 25% to 14%. The rise in US Treasury yields not only reflects the market's pricing in tightening monetary policy but also directly supports the rapid rebound of the US dollar index through interest rate differentials. Driven by both risk aversion and interest rate differentials, the US dollar is expected to remain strong in the next 2-3 trading days, and if US Treasury yields break through the key resistance level of 4.479% , it will further strengthen the dollar's dominance.
Today's performance of spot gold reflects an extremely complex logic of asset correlation. Although geopolitical tensions are usually beneficial to gold, the current crisis, accompanied by soaring energy prices, has seen the "high interest rate expectations" transmitted from the bond market overshadow gold's "safe-haven attribute." Technically, gold is currently priced at around 4617.78 , below 4631.98 (the Bollinger Band's middle line), showing clear signs of a breakout. The previous oversold rebound from 4099.02 encountered resistance and fell back after reaching 4800.22 , with consecutive bearish candlesticks indicating that the bearish release process is not yet over.
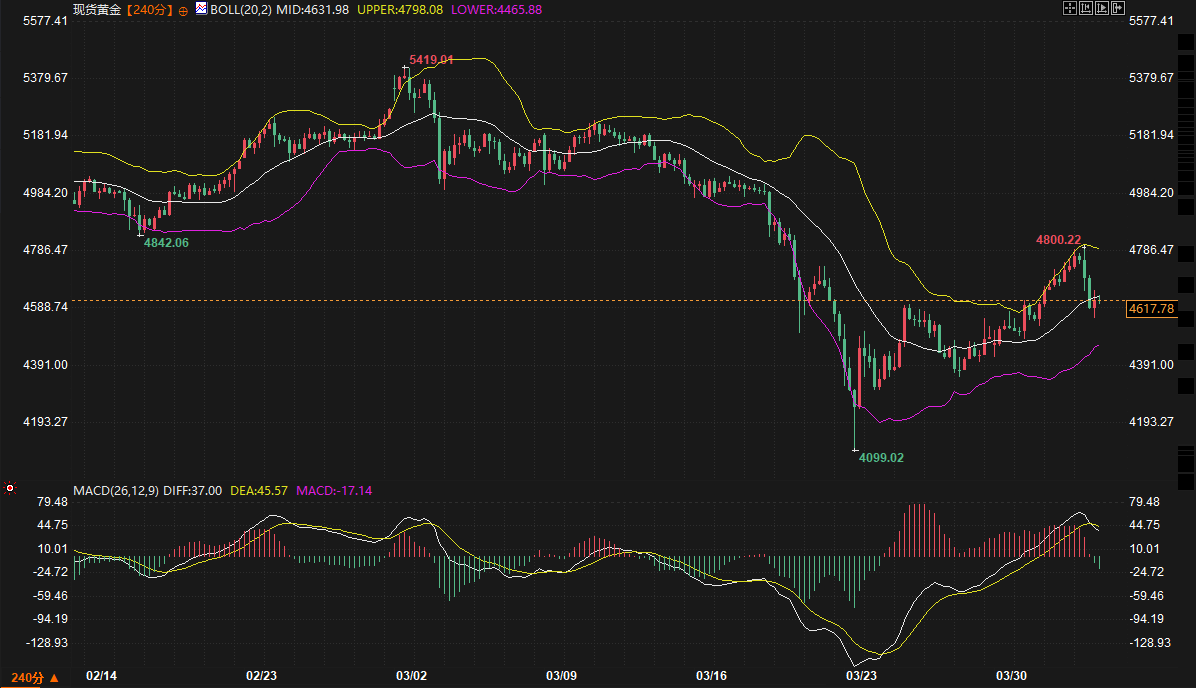
From the perspective of bond market transmission, the rise in US Treasury yields has significantly increased the opportunity cost of holding gold, a non-interest-bearing asset. When the market believes that inflation will lead to the Federal Reserve's "higher and longer" interest rate policy, funds are more inclined to flow into dollar assets with coupon income. The MACD histogram remains negative, although it is shortening, but the death cross of DIFF and DEA suggests that short-term rebound momentum is still lacking. If gold prices cannot effectively recover the middle band in the short term, and US Treasury yields continue to remain above 4.3%, gold may retest the support near the lower band of 4465.88 . Gold's current predicament is that it is negatively correlated with oil prices. Every point that oil prices rise due to geopolitical conflicts adds pressure to gold due to inflation-driven expectations of interest rate hikes.
Looking ahead to the short term, the market will enter a sensitive period of "high volatility and strong correlation." Technically, the US dollar is expected to consolidate at higher levels or attempt a breakout, fluctuating around the US Treasury yield. The 4.400-4.479 range will be a key observation point for whether the bond market can lead the dollar into a new round of gains. If the 10-year US Treasury yield encounters resistance and falls back within this range, the dollar may enter a period of consolidation, providing a respite for gold.
In the gold market, short-term resistance is concentrated in the 4798-4800 range. If this area cannot be broken with significant volume, the downward trend is unlikely to reverse. Over the next 2-3 days, key focus will be on the upcoming non-farm payroll data and public statements from Federal Reserve officials. Due to geopolitical uncertainties, the "shift" of safe-haven funds between the US dollar and gold will continue. If tariff rhetoric or other international trade uncertainties escalate further, the market may, in extreme cases, experience a "dual safe-haven" scenario where gold and the US dollar rise simultaneously. However, given the current dominance of inflationary logic, this possibility is relatively low.
Why did gold prices plummet despite the deteriorating geopolitical situation?
This is primarily because the current geopolitical situation directly led to a surge in oil prices. The soaring oil prices triggered market concerns about runaway inflation, which in turn pushed up US Treasury yields and significantly reduced market expectations for a Federal Reserve interest rate cut. Gold, as a non-interest-bearing asset, lost much of its appeal amid rising interest rate expectations. At this point, the US dollar, with its safe-haven properties and interest rate advantage, replaced gold as the more favored safe-haven asset, forming a transmission chain of "rising oil prices – rising bond yields – falling gold prices."
How long will the current pressure on gold prices from US Treasury yields last?
The key lies in whether inflation expectations can be quelled. As long as oil prices remain high due to the situation, US Treasury yields are unlikely to see a significant pullback. Technically, the 10-year US Treasury yield is currently holding above 4.3% and showing a tendency to form a golden cross, meaning that negative pressure on gold from the bond market will remain in the next 2-3 days. This will be unless there are unexpected signs of de-escalation in geopolitical tensions or a significant weakening of economic data forces the Federal Reserve to reconsider its stance.
What role does the US dollar play in the current safe-haven logic?
The US dollar currently plays the role of a "safe haven for liquidity." When global markets are unsettled by unexpected statements, investors first seek the most liquid assets that can benefit from expectations of interest rate hikes. The dollar not only hedges against geopolitical risks but also gains a premium from rising US Treasury yields. As long as market logic remains focused on "inflation concerns" rather than "a full-blown recession," this dual advantage of the dollar will continue to suppress other safe-haven assets.
Has the downside potential for gold been opened up?
Technically, gold prices have broken below the Bollinger Band's middle line and are showing signs of weakening after a rebound encountered resistance. If gold prices cannot quickly recover the resistance level near 4631, there is indeed a risk of testing the support level of 4465 in the short term. However, in the long term, structural demand for gold (such as central bank gold purchases) still exists, and the current decline is more of a technical correction to the sharp fluctuations in March and a repricing of the interest rate environment.
What are the key areas of focus in the coming days?
First, there's the future trend of crude oil prices, which serves as a bridge between geopolitical tensions and inflation expectations. Second, there are the speeches from several Federal Reserve voting members, especially their latest views on inflation and the path of interest rate cuts. Finally, from a technical perspective, close attention needs to be paid to whether the 10-year US Treasury yield will break through the previous high of 4.479%, and how well gold will stabilize in the 4465-4500 support zone. These factors will determine whether the US dollar can maintain its dominant position in the next 2-3 days.
Bond Market Logic Reconstruction: Inflation Concerns Drive US Treasury Yields Back Upwards, Supporting a Stronger Dollar
Recent volatility in the US Treasury market has been a key driver of the dollar's strength. From a technical perspective, the 10-year US Treasury yield is currently at 4.369% , within a high-level consolidation range. Although it retreated in late March, it found strong support near the Bollinger Band middle line at 4.330 . The MACD indicator shows that the DIFF is about to cross above the DEA to form a golden cross , and the red bars are turning positive, indicating that the short-term downward momentum has largely exhausted itself, and bullish forces are accumulating.
Fundamentally, the escalating external situation directly pushed up crude oil prices, with a single-day increase of about 7% exacerbating market fears of sticky inflation . A well-known institution's analysis points out that the inflationary pressure from rising oil prices will force the Federal Reserve to maintain high interest rates for a longer period. According to the latest data, market expectations for a December rate cut have dropped sharply from 25% to 14%. The rise in US Treasury yields not only reflects the market's pricing in tightening monetary policy but also directly supports the rapid rebound of the US dollar index through interest rate differentials. Driven by both risk aversion and interest rate differentials, the US dollar is expected to remain strong in the next 2-3 trading days, and if US Treasury yields break through the key resistance level of 4.479% , it will further strengthen the dollar's dominance.
Gold's safe-haven appeal is under pressure: The spillover effect from the bond market triggers a sharp drop in gold prices.
Today's performance of spot gold reflects an extremely complex logic of asset correlation. Although geopolitical tensions are usually beneficial to gold, the current crisis, accompanied by soaring energy prices, has seen the "high interest rate expectations" transmitted from the bond market overshadow gold's "safe-haven attribute." Technically, gold is currently priced at around 4617.78 , below 4631.98 (the Bollinger Band's middle line), showing clear signs of a breakout. The previous oversold rebound from 4099.02 encountered resistance and fell back after reaching 4800.22 , with consecutive bearish candlesticks indicating that the bearish release process is not yet over.
From the perspective of bond market transmission, the rise in US Treasury yields has significantly increased the opportunity cost of holding gold, a non-interest-bearing asset. When the market believes that inflation will lead to the Federal Reserve's "higher and longer" interest rate policy, funds are more inclined to flow into dollar assets with coupon income. The MACD histogram remains negative, although it is shortening, but the death cross of DIFF and DEA suggests that short-term rebound momentum is still lacking. If gold prices cannot effectively recover the middle band in the short term, and US Treasury yields continue to remain above 4.3%, gold may retest the support near the lower band of 4465.88 . Gold's current predicament is that it is negatively correlated with oil prices. Every point that oil prices rise due to geopolitical conflicts adds pressure to gold due to inflation-driven expectations of interest rate hikes.
Outlook for the next 2-3 days: Focus on liquidity premium and policy guidance
Looking ahead to the short term, the market will enter a sensitive period of "high volatility and strong correlation." Technically, the US dollar is expected to consolidate at higher levels or attempt a breakout, fluctuating around the US Treasury yield. The 4.400-4.479 range will be a key observation point for whether the bond market can lead the dollar into a new round of gains. If the 10-year US Treasury yield encounters resistance and falls back within this range, the dollar may enter a period of consolidation, providing a respite for gold.
In the gold market, short-term resistance is concentrated in the 4798-4800 range. If this area cannot be broken with significant volume, the downward trend is unlikely to reverse. Over the next 2-3 days, key focus will be on the upcoming non-farm payroll data and public statements from Federal Reserve officials. Due to geopolitical uncertainties, the "shift" of safe-haven funds between the US dollar and gold will continue. If tariff rhetoric or other international trade uncertainties escalate further, the market may, in extreme cases, experience a "dual safe-haven" scenario where gold and the US dollar rise simultaneously. However, given the current dominance of inflationary logic, this possibility is relatively low.
Frequently Asked Questions
Why did gold prices plummet despite the deteriorating geopolitical situation?
This is primarily because the current geopolitical situation directly led to a surge in oil prices. The soaring oil prices triggered market concerns about runaway inflation, which in turn pushed up US Treasury yields and significantly reduced market expectations for a Federal Reserve interest rate cut. Gold, as a non-interest-bearing asset, lost much of its appeal amid rising interest rate expectations. At this point, the US dollar, with its safe-haven properties and interest rate advantage, replaced gold as the more favored safe-haven asset, forming a transmission chain of "rising oil prices – rising bond yields – falling gold prices."
How long will the current pressure on gold prices from US Treasury yields last?
The key lies in whether inflation expectations can be quelled. As long as oil prices remain high due to the situation, US Treasury yields are unlikely to see a significant pullback. Technically, the 10-year US Treasury yield is currently holding above 4.3% and showing a tendency to form a golden cross, meaning that negative pressure on gold from the bond market will remain in the next 2-3 days. This will be unless there are unexpected signs of de-escalation in geopolitical tensions or a significant weakening of economic data forces the Federal Reserve to reconsider its stance.
What role does the US dollar play in the current safe-haven logic?
The US dollar currently plays the role of a "safe haven for liquidity." When global markets are unsettled by unexpected statements, investors first seek the most liquid assets that can benefit from expectations of interest rate hikes. The dollar not only hedges against geopolitical risks but also gains a premium from rising US Treasury yields. As long as market logic remains focused on "inflation concerns" rather than "a full-blown recession," this dual advantage of the dollar will continue to suppress other safe-haven assets.
Has the downside potential for gold been opened up?
Technically, gold prices have broken below the Bollinger Band's middle line and are showing signs of weakening after a rebound encountered resistance. If gold prices cannot quickly recover the resistance level near 4631, there is indeed a risk of testing the support level of 4465 in the short term. However, in the long term, structural demand for gold (such as central bank gold purchases) still exists, and the current decline is more of a technical correction to the sharp fluctuations in March and a repricing of the interest rate environment.
What are the key areas of focus in the coming days?
First, there's the future trend of crude oil prices, which serves as a bridge between geopolitical tensions and inflation expectations. Second, there are the speeches from several Federal Reserve voting members, especially their latest views on inflation and the path of interest rate cuts. Finally, from a technical perspective, close attention needs to be paid to whether the 10-year US Treasury yield will break through the previous high of 4.479%, and how well gold will stabilize in the 4465-4500 support zone. These factors will determine whether the US dollar can maintain its dominant position in the next 2-3 days.
- Risk Warning and Disclaimer
- The market involves risk, and trading may not be suitable for all investors. This article is for reference only and does not constitute personal investment advice, nor does it take into account certain users’ specific investment objectives, financial situation, or other needs. Any investment decisions made based on this information are at your own risk.