Just as US Treasury bonds were about to rebound, Hormuz pushed them back down; only two days remain for the showdown between gold bulls and bears.
2026-04-09 20:24:20
On Thursday (April 9th), global financial markets were at a very delicate juncture. Although the fragile ceasefire agreement reached earlier temporarily suppressed some risk aversion, the latest developments indicate that concerns about shipping safety in the Strait of Hormuz have resurfaced. Reputable institutions point out that, due to the lack of substantial resolution to the core geopolitical conflicts, current market optimism is rapidly evaporating. Meanwhile, the latest minutes of the Federal Reserve's meeting released a clearly hawkish signal, indicating that the urgency of inflation control remains higher than previously expected by the market. Affected by this, US Treasury yields , the US dollar index , and spot gold , after a period of volatility, entered a critical technical correction phase.

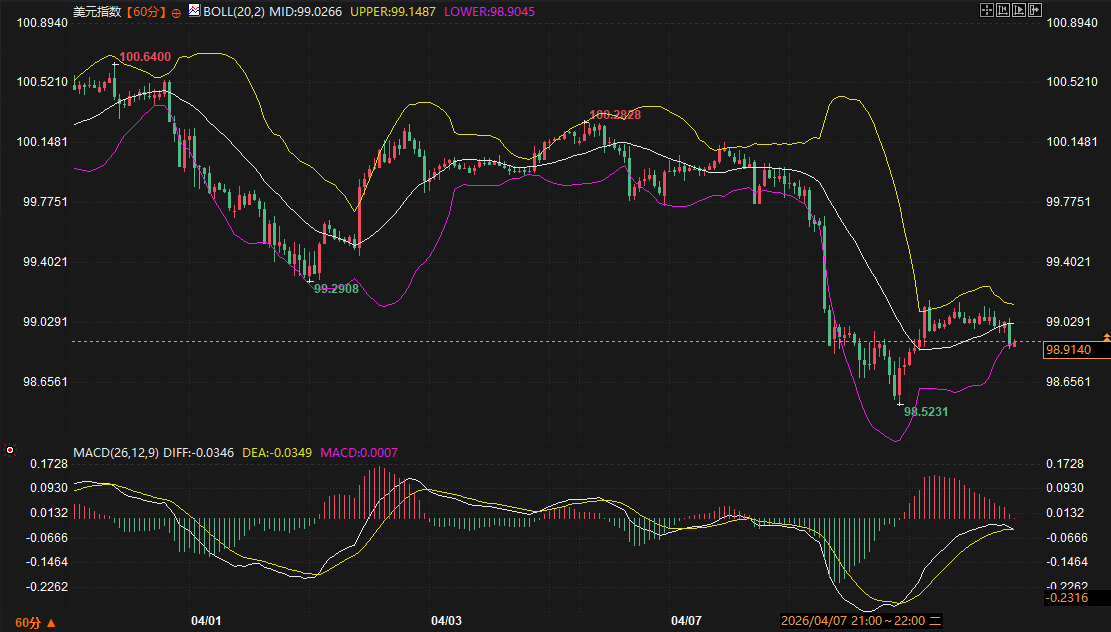
According to the latest disclosed meeting minutes, policymakers' confidence in the return of inflation to the 2% target has wavered, with some officials even hinting at the possibility of further interest rate hikes if inflation continues to deviate from the target. This "tightening bias" provides underlying support for the US dollar index . Technically, the US dollar index rebounded slightly after hitting a low of 98.5231 and is currently trading at 98.914, testing resistance near the Bollinger Band middle line at 99.0266. The MACD indicator shows a near balance between bullish and bearish forces, suggesting that the short-term rebound momentum is insufficient to reverse the previous downward trend. In the next 2-3 days, if the US dollar index fails to effectively hold above 99.00, it will likely retreat to the 98.50-98.70 range to seek support.
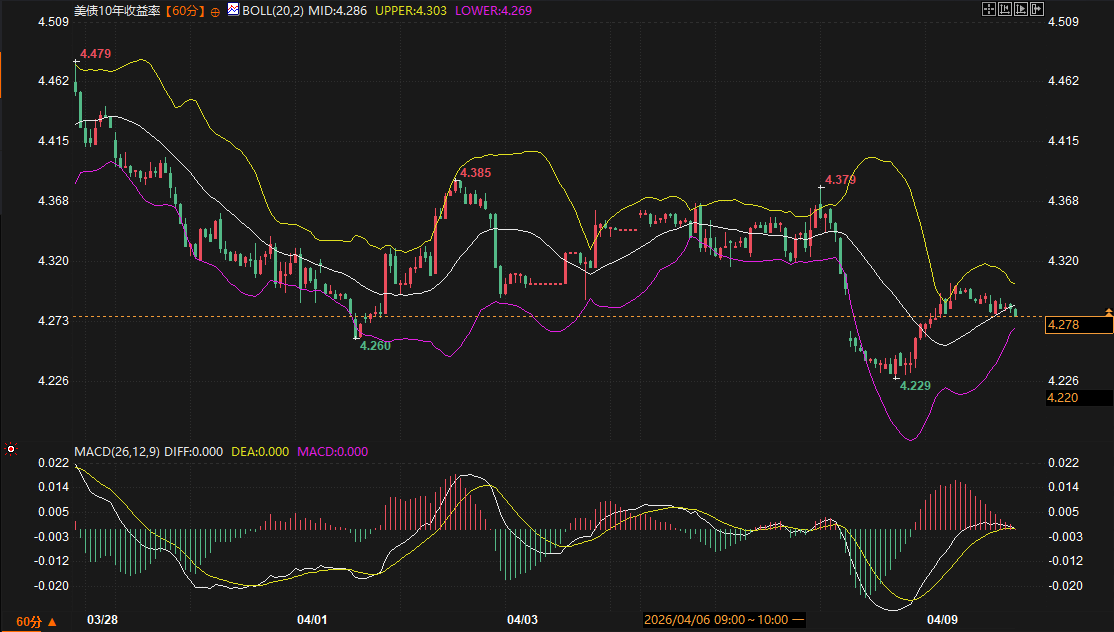
In the US Treasury market, the 10-year Treasury yield is currently at 4.278%, trading below the Bollinger Band's middle band. Looking at the 60-minute chart, the MACD histogram is contracting, indicating a temporary weakening of bearish momentum, but the resistance from the middle band around 4.286% remains significant. Analysts from well-known institutions believe that US Treasury yields exhibit strong two-way oscillations within the 4.27% to 4.32% range. Considering the upcoming initial jobless claims and February core PCE price index, if the data confirms economic resilience and core inflation remains high at 0.4%, yields may retest the resistance zone of 4.30%–4.35%. Conversely, if geopolitical risks escalate further, safe-haven buying could push yields down to around the support level of 4.23%.
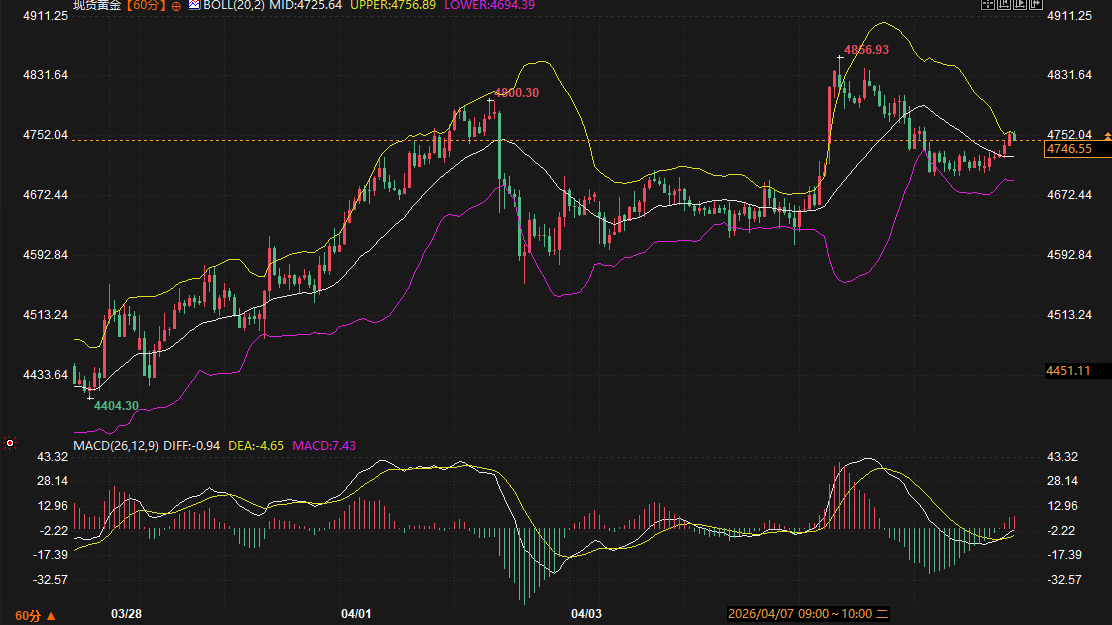
After hitting a record high of $4,856.93 per ounce, spot gold has recently experienced a deep pullback of nearly $110, currently trading at $4,746.55 per ounce. This volatility reflects the complex market sentiment, shifting from optimism to skepticism regarding the ceasefire agreement. From a technical perspective, gold prices found key support above the Bollinger Band middle line at $4,725.64. The MACD histogram is beginning to show a bullish trend, and although the DIFF and DEA lines are in negative territory, they have shown signs of stabilization and recovery, indicating that short-term selling pressure has been somewhat alleviated.
The current support zone is between $4695 and $4725, while the resistance zone is concentrated between $4757 and $4800. Although the potential for a deterioration in geopolitical tensions provides a safe-haven appeal for gold, the Federal Reserve's hawkish stance and potential pressure from core PCE data limit the potential for gold prices to return above $4800 in the short term. In the next 2-3 trading days, gold will likely maintain a wide range of fluctuations between $4720 and $4780, awaiting guidance from important economic data later this week.
Based on a comprehensive analysis of fundamentals and technical factors, the main theme of market movement over the next 2-3 days will be "data-driven consolidation and correction." Recurring geopolitical risks will provide a floor for gold and the US dollar, preventing a one-sided collapse in asset prices. However, the expectation of a persistently high core PCE price index suggests that the Federal Reserve is unlikely to shift to an easing stance in the short term, which constitutes a major obstacle to further gains in commodities.
The US dollar index is expected to test the upper Bollinger Band resistance at 99.15; the 10-year US Treasury yield is likely to fluctuate around the 4.28% level, finding direction within the 4.23%-4.32% range. For spot gold , the effectiveness of the $4725 support level will determine whether it can initiate a new round of upward testing. Overall market sentiment remains biased towards "selling on rallies," with investors showing low confidence in geopolitical agreements; unforeseen events could boost volatility.
1. What impact did the latest Federal Reserve meeting minutes have on market sentiment?
The meeting minutes revealed that Federal Reserve officials were not satisfied with the pace of inflation cooling, reinforcing market expectations that interest rates would remain high for an extended period. This hawkish bias directly boosted the underlying resilience of the dollar, while also putting downward pressure on spot gold, causing gold prices to stall at higher levels.
2. Why is it said that the current ceasefire agreement is having a diminishing impact on the market?
Market observations suggest that despite the ceasefire agreement, localized skirmishes have not ended, and the threat to key shipping lanes such as the Strait of Hormuz remains. This expectation of a "nominal but ineffective" ceasefire makes it difficult for the safe-haven premium to completely dissipate, and asset prices retain strong safe-haven characteristics after brief corrections.
3. What are the key economic indicators that will influence the US dollar index trend over the next two days?
The key focus will be on Thursday's weekly initial jobless claims and the February core PCE price index. As the Fed's preferred inflation gauge, a core PCE increase of 0.4% or higher would significantly strengthen the dollar's rebound logic.
4. Where are the current technical support and resistance levels for spot gold?
The first support level is currently at $4,725 (Bollinger Band middle line). If it breaks below this level, the next support level to watch is $4,694. The first resistance level is at $4,757 (Bollinger Band upper line), with stronger resistance at the $4,800 psychological level.
5. Why has the 10-year US Treasury yield shown a volatile pattern recently?
The main reason is the offsetting effect of multiple factors: on the one hand, upward pressure from hawkish Fed policies, and on the other hand, downward pressure from safe-haven buying triggered by geopolitical uncertainties. The balance of these two forces has caused yields to fluctuate within a narrow range of 4.23% to 4.32%.
US Treasuries and the US Dollar: A Battle Between Tightening Expectations and Safe-Haven Demand
According to the latest disclosed meeting minutes, policymakers' confidence in the return of inflation to the 2% target has wavered, with some officials even hinting at the possibility of further interest rate hikes if inflation continues to deviate from the target. This "tightening bias" provides underlying support for the US dollar index . Technically, the US dollar index rebounded slightly after hitting a low of 98.5231 and is currently trading at 98.914, testing resistance near the Bollinger Band middle line at 99.0266. The MACD indicator shows a near balance between bullish and bearish forces, suggesting that the short-term rebound momentum is insufficient to reverse the previous downward trend. In the next 2-3 days, if the US dollar index fails to effectively hold above 99.00, it will likely retreat to the 98.50-98.70 range to seek support.
In the US Treasury market, the 10-year Treasury yield is currently at 4.278%, trading below the Bollinger Band's middle band. Looking at the 60-minute chart, the MACD histogram is contracting, indicating a temporary weakening of bearish momentum, but the resistance from the middle band around 4.286% remains significant. Analysts from well-known institutions believe that US Treasury yields exhibit strong two-way oscillations within the 4.27% to 4.32% range. Considering the upcoming initial jobless claims and February core PCE price index, if the data confirms economic resilience and core inflation remains high at 0.4%, yields may retest the resistance zone of 4.30%–4.35%. Conversely, if geopolitical risks escalate further, safe-haven buying could push yields down to around the support level of 4.23%.
Spot gold: Technical correction after high-level pullback
After hitting a record high of $4,856.93 per ounce, spot gold has recently experienced a deep pullback of nearly $110, currently trading at $4,746.55 per ounce. This volatility reflects the complex market sentiment, shifting from optimism to skepticism regarding the ceasefire agreement. From a technical perspective, gold prices found key support above the Bollinger Band middle line at $4,725.64. The MACD histogram is beginning to show a bullish trend, and although the DIFF and DEA lines are in negative territory, they have shown signs of stabilization and recovery, indicating that short-term selling pressure has been somewhat alleviated.
The current support zone is between $4695 and $4725, while the resistance zone is concentrated between $4757 and $4800. Although the potential for a deterioration in geopolitical tensions provides a safe-haven appeal for gold, the Federal Reserve's hawkish stance and potential pressure from core PCE data limit the potential for gold prices to return above $4800 in the short term. In the next 2-3 trading days, gold will likely maintain a wide range of fluctuations between $4720 and $4780, awaiting guidance from important economic data later this week.
Future Outlook
Based on a comprehensive analysis of fundamentals and technical factors, the main theme of market movement over the next 2-3 days will be "data-driven consolidation and correction." Recurring geopolitical risks will provide a floor for gold and the US dollar, preventing a one-sided collapse in asset prices. However, the expectation of a persistently high core PCE price index suggests that the Federal Reserve is unlikely to shift to an easing stance in the short term, which constitutes a major obstacle to further gains in commodities.
The US dollar index is expected to test the upper Bollinger Band resistance at 99.15; the 10-year US Treasury yield is likely to fluctuate around the 4.28% level, finding direction within the 4.23%-4.32% range. For spot gold , the effectiveness of the $4725 support level will determine whether it can initiate a new round of upward testing. Overall market sentiment remains biased towards "selling on rallies," with investors showing low confidence in geopolitical agreements; unforeseen events could boost volatility.
Frequently Asked Questions
1. What impact did the latest Federal Reserve meeting minutes have on market sentiment?
The meeting minutes revealed that Federal Reserve officials were not satisfied with the pace of inflation cooling, reinforcing market expectations that interest rates would remain high for an extended period. This hawkish bias directly boosted the underlying resilience of the dollar, while also putting downward pressure on spot gold, causing gold prices to stall at higher levels.
2. Why is it said that the current ceasefire agreement is having a diminishing impact on the market?
Market observations suggest that despite the ceasefire agreement, localized skirmishes have not ended, and the threat to key shipping lanes such as the Strait of Hormuz remains. This expectation of a "nominal but ineffective" ceasefire makes it difficult for the safe-haven premium to completely dissipate, and asset prices retain strong safe-haven characteristics after brief corrections.
3. What are the key economic indicators that will influence the US dollar index trend over the next two days?
The key focus will be on Thursday's weekly initial jobless claims and the February core PCE price index. As the Fed's preferred inflation gauge, a core PCE increase of 0.4% or higher would significantly strengthen the dollar's rebound logic.
4. Where are the current technical support and resistance levels for spot gold?
The first support level is currently at $4,725 (Bollinger Band middle line). If it breaks below this level, the next support level to watch is $4,694. The first resistance level is at $4,757 (Bollinger Band upper line), with stronger resistance at the $4,800 psychological level.
5. Why has the 10-year US Treasury yield shown a volatile pattern recently?
The main reason is the offsetting effect of multiple factors: on the one hand, upward pressure from hawkish Fed policies, and on the other hand, downward pressure from safe-haven buying triggered by geopolitical uncertainties. The balance of these two forces has caused yields to fluctuate within a narrow range of 4.23% to 4.32%.
- Risk Warning and Disclaimer
- The market involves risk, and trading may not be suitable for all investors. This article is for reference only and does not constitute personal investment advice, nor does it take into account certain users’ specific investment objectives, financial situation, or other needs. Any investment decisions made based on this information are at your own risk.