PPI data falls short of expectations; soaring energy prices fail to mask signs of slowing inflation?
2026-04-14 20:59:38
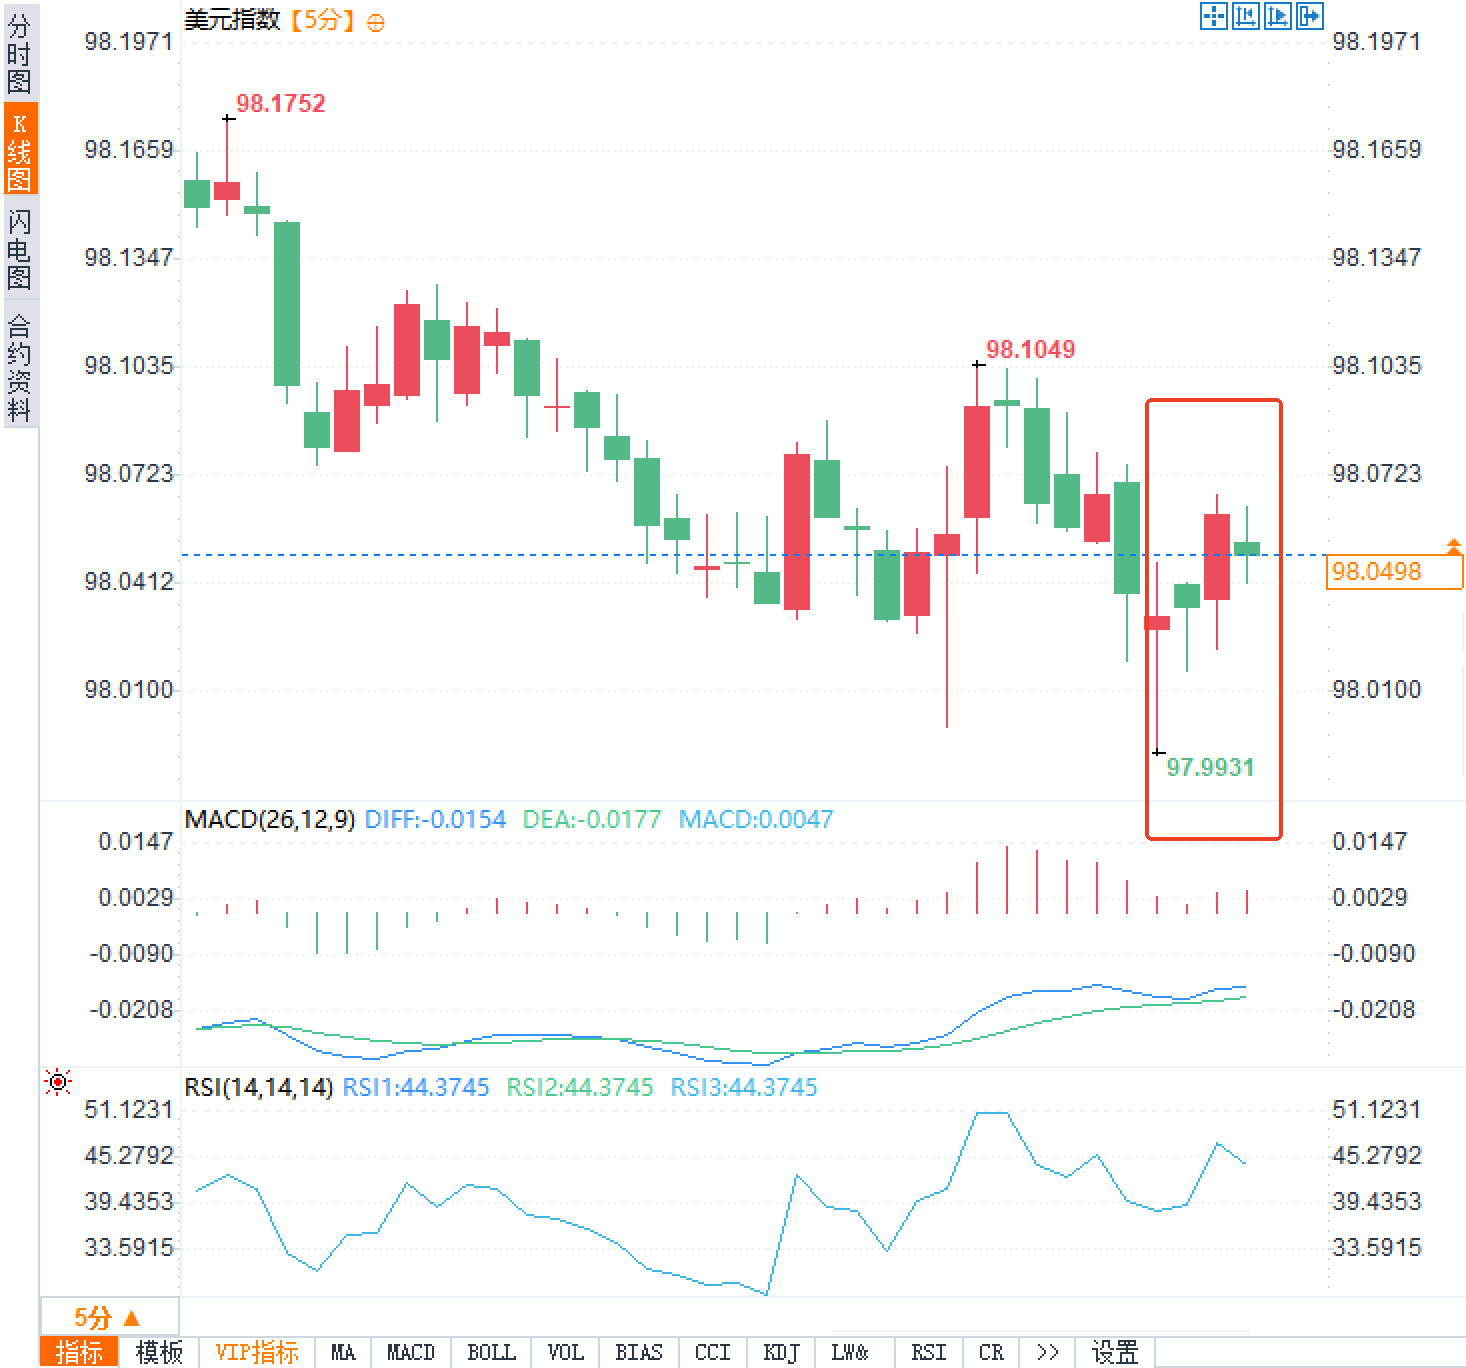
On Tuesday, April 14th, the US March final demand producer price index (PPI) was released, showing a year-on-year increase of 4.0%, significantly lower than the market consensus expectation of 4.7%, and a month-on-month increase of 0.5%, also below the expected value of 1.1%. Following the data release, the US dollar index continued its intraday decline, hovering around the 98.00 level, reflecting the market's immediate interpretation of a temporary easing of inflationary pressures on the production side.

Meanwhile, energy prices remained volatile due to geopolitical factors, with crude oil futures maintaining high levels of fluctuation. However, upstream raw material prices, such as natural gas, showed significant divergence, which was directly reflected in the structural misalignment of PPI components. Overall, this data highlights the complexity of the pricing transmission path: although energy costs have partially entered the end-user market, the pricing power of the service sector has weakened significantly. Coupled with previous policy adjustments, core inflationary momentum has shown a marginal slowdown.
The PPI data fell short of expectations across multiple dimensions, primarily due to the month-on-month growth rate being significantly weaker than market forecasts for energy premiums. The final demand index rose 4.0% year-on-year, a slight increase from the revised 3.4% in February, but only 0.5% month-on-month, 0.6 percentage points lower than expected. The core indicator (excluding food and energy) rose 3.8% year-on-year and 0.1% month-on-month, both also below expectations, indicating that potential pricing pressures have not spread as rapidly as the market feared.
The super core indicator (excluding food, energy, and trade services) rose only 0.2% month-on-month, a significant drop from the 0.5% level of the previous two months, indicating that the basic pricing momentum on the production side has slowed down. The goods sector contributed 1.6% month-on-month, mainly driven by energy; the services sector remained flat at 0.0%, with the sector, which accounts for as much as 68% of the weighting, failing to provide additional support and directly dragging down the overall reading.
The energy component became the most dramatic part of the data. Final demand energy prices surged 8.5% month-on-month, with gasoline rising 15.7%, diesel 42.0%, jet fuel 30.7%, and heating oil 39.4%, indicating that crude oil costs have been rapidly passed on to downstream refining stages. However, the price of unprocessed natural gas plummeted 51.7% that month, significantly dragging down intermediate demand. Crude oil's cumulative increase over the past 12 months was only 12.3%, lower than the rise in refined products, explaining why market expectations of a "comprehensive energy premium" have not been fully realized.
The biggest surprise in this data release was the unexpected flat performance of service sector prices. Trade services saw a marginal decline of 0.3%, with wholesale food and alcohol prices falling by 6.0% and retail fuel and lubricant prices declining by 10.2%. This suggests that retailers are choosing to absorb some of the pressure from rising energy costs rather than passing it all on to consumers, a stark contrast to typical cost-push models. "Other services" rose by only 0.1%, with commissions for securities brokerage, deposit services, and residential property brokerage all declining. While transportation and warehousing services rose 1.3% month-on-month (air passenger fares +2.8%, truck freight +1.0%), its weighting of only about 5% is insufficient to offset the overall drag. It is worth noting that real-time airfares already indicate a future increase of 30-40%, suggesting that some of the transmission effects are still in the pipeline.
Final food demand prices fell 0.3% month-over-month, with fresh and dried vegetables down 10.7% and minimally processed consumer foods down 10.0%, further weighing on the overall reading. The supercore index, excluding food, energy, trade, and services, rose only 0.2% month-over-month, confirming a marginal weakening of underlying pricing power.
Following the Supreme Court's 6-3 ruling on February 20th to overturn the massive IEEPA tariffs, March data captured the window of opportunity immediately following the repeal of the major tariff regime. The subsequent replacement with a 10% global tariff, significantly lower than the previous plan, alleviated additional upward pressure on import costs, becoming one of the key factors contributing to the flat performance of the services sector.
While current energy prices have partially reflected the impact of inflation, the Strait of Hormuz has not yet fully reopened to navigation, and the tight crude oil inventory situation has not eased. The cost of refined products may continue to permeate to end-users. A collapse in natural gas demand could provide reverse cost support to the chemical and power industries in the coming months, alleviating some upstream pressure. Overall, PPI data shows that inflation on the production side is not out of control, and there are clear signs of softening pricing power. However, the energy pipeline effect still needs to be continuously monitored to determine whether it will temporarily push up subsequent readings.
Meanwhile, energy prices remained volatile due to geopolitical factors, with crude oil futures maintaining high levels of fluctuation. However, upstream raw material prices, such as natural gas, showed significant divergence, which was directly reflected in the structural misalignment of PPI components. Overall, this data highlights the complexity of the pricing transmission path: although energy costs have partially entered the end-user market, the pricing power of the service sector has weakened significantly. Coupled with previous policy adjustments, core inflationary momentum has shown a marginal slowdown.
Key Interpretations of March PPI Data
The PPI data fell short of expectations across multiple dimensions, primarily due to the month-on-month growth rate being significantly weaker than market forecasts for energy premiums. The final demand index rose 4.0% year-on-year, a slight increase from the revised 3.4% in February, but only 0.5% month-on-month, 0.6 percentage points lower than expected. The core indicator (excluding food and energy) rose 3.8% year-on-year and 0.1% month-on-month, both also below expectations, indicating that potential pricing pressures have not spread as rapidly as the market feared.
| index | March actual | Market expectations | February revised value |
|---|---|---|---|
| Final demand PPI year-on-year | 4.0% | 4.7% | 3.4% |
| Final demand PPI month-on-month | 0.5% | 1.1% | 0.5% |
| Core PPI year-on-year | 3.8% | 4.2% | 3.8% |
| Core PPI month-on-month | 0.1% | 0.5% | 0.3% |
| Super Core PPI Month-on-Month | 0.2% | — | 0.5% |
Structural misalignment of sub-driving factors
The energy component became the most dramatic part of the data. Final demand energy prices surged 8.5% month-on-month, with gasoline rising 15.7%, diesel 42.0%, jet fuel 30.7%, and heating oil 39.4%, indicating that crude oil costs have been rapidly passed on to downstream refining stages. However, the price of unprocessed natural gas plummeted 51.7% that month, significantly dragging down intermediate demand. Crude oil's cumulative increase over the past 12 months was only 12.3%, lower than the rise in refined products, explaining why market expectations of a "comprehensive energy premium" have not been fully realized.
The biggest surprise in this data release was the unexpected flat performance of service sector prices. Trade services saw a marginal decline of 0.3%, with wholesale food and alcohol prices falling by 6.0% and retail fuel and lubricant prices declining by 10.2%. This suggests that retailers are choosing to absorb some of the pressure from rising energy costs rather than passing it all on to consumers, a stark contrast to typical cost-push models. "Other services" rose by only 0.1%, with commissions for securities brokerage, deposit services, and residential property brokerage all declining. While transportation and warehousing services rose 1.3% month-on-month (air passenger fares +2.8%, truck freight +1.0%), its weighting of only about 5% is insufficient to offset the overall drag. It is worth noting that real-time airfares already indicate a future increase of 30-40%, suggesting that some of the transmission effects are still in the pipeline.
Final food demand prices fell 0.3% month-over-month, with fresh and dried vegetables down 10.7% and minimally processed consumer foods down 10.0%, further weighing on the overall reading. The supercore index, excluding food, energy, trade, and services, rose only 0.2% month-over-month, confirming a marginal weakening of underlying pricing power.
The follow-up impact of policy adjustments and inflation transmission
Following the Supreme Court's 6-3 ruling on February 20th to overturn the massive IEEPA tariffs, March data captured the window of opportunity immediately following the repeal of the major tariff regime. The subsequent replacement with a 10% global tariff, significantly lower than the previous plan, alleviated additional upward pressure on import costs, becoming one of the key factors contributing to the flat performance of the services sector.
While current energy prices have partially reflected the impact of inflation, the Strait of Hormuz has not yet fully reopened to navigation, and the tight crude oil inventory situation has not eased. The cost of refined products may continue to permeate to end-users. A collapse in natural gas demand could provide reverse cost support to the chemical and power industries in the coming months, alleviating some upstream pressure. Overall, PPI data shows that inflation on the production side is not out of control, and there are clear signs of softening pricing power. However, the energy pipeline effect still needs to be continuously monitored to determine whether it will temporarily push up subsequent readings.
Frequently Asked Questions
Question 1: Why was the month-on-month growth rate of PPI in March much lower than expected, and where does the main problem lie?
A: Market expectations were based on a broad and significant transmission of energy prices, but the actual energy sector presented a "double story": while refined product prices did surge by 8.5%, this was largely offset by a 51.7% collapse in natural gas prices. Meanwhile, the service sector remained flat at 0.0%, and trade services saw a marginal decline of 0.3%. Retailers' cost-absorbing behavior further weakened the transmission efficiency, resulting in an overall month-on-month increase of only 0.5%, 0.6 percentage points lower than expected.
Question 2: What does the slowdown in the super core PPI to 0.2% month-on-month mean for the medium- to long-term inflation trend?
A: The super core index, excluding the most volatile sectors such as food, energy, and trade services, showed a month-on-month increase of only 0.2%, indicating a significant slowdown in the fundamental pricing momentum on the production side, down from the 0.5% level of the previous two months. This suggests that companies' pricing power has weakened under demand-side constraints, and although energy costs are still in the pipeline, the overall second round of inflationary pressure is more moderate than the market had previously anticipated.
Question 3: How will the tariff policy adjustment affect the current PPI reading, and what variables should be monitored going forward?
A: Following the Supreme Court's repeal of the massive tariffs imposed under the International Economic Partnership Arrangement (IEEPA) on February 20, March data precisely reflected the transition window between the old and new systems. The 10% global tariff was significantly reduced, alleviating the pressure on import costs. Going forward, it is crucial to monitor whether the energy pipeline effect continues to unfold and whether the service sector can maintain its current pricing restraint to determine whether inflation will return to an accelerating trajectory.
- Risk Warning and Disclaimer
- The market involves risk, and trading may not be suitable for all investors. This article is for reference only and does not constitute personal investment advice, nor does it take into account certain users’ specific investment objectives, financial situation, or other needs. Any investment decisions made based on this information are at your own risk.