The Iranian conflict has lasted for a month and a half: has the wide-range fluctuation pattern of crude oil been established?
2026-04-15 19:37:12
A month and a half has passed since the US-Israel military action against Iran began on February 28, 2026. This conflict, from the blockade of the Strait of Hormuz to multiple rounds of escalation and ceasefire negotiations, has completely reshaped the narrative of the oil market. Brent crude surged from around $72 per barrel before the war to a March high of $119.50, marking the largest single-month increase in the contract's history (51%-55%), before entering a period of extreme volatility amidst protracted negotiations.

Amidst ongoing tensions, unresolved structural contradictions between Iran and the United States, and negotiations turning into a war of attrition, crude oil prices have evolved from an initial one-sided supply shock to wide-range fluctuations. Given the extended timeframe (if the conflict remains unresolved by May 1st), crude oil prices may test higher levels, but the dominant trend for the month will likely remain range-bound.
A Month and a Half of War: The Driving Logic Behind Four Rounds of Extreme K-Line Charts
Since the outbreak of the war, Brent crude oil's daily and weekly charts have been filled with numerous significant bullish and bearish candlesticks. These extreme price movements are not random, but rather a precise reflection of supply panic, inventory release, demand disruption, and negotiation expectations.
(I) Late February to early March: Consecutive large positive lines, supply panic and soaring prices
After the US-Israel action was launched on February 28, there were large gains of 8%-13% on March 1-2; after Iran announced the blockade of the Strait of Hormuz on March 4, multiple large gains pushed the price from $72 to $90-$100, and even reached a peak of $119.50.
This was described as "the largest supply disruption in the history of the global oil market" (IEA's original words). Transportation to the Hormuz was paralyzed by 20 million barrels per day, and production shutdowns in the Middle East surged from 7.5 million barrels per day. The market experienced a supply precipitate, leading to a sharp rise in freight and insurance costs, with spot prices reaching $150 per barrel, far exceeding futures prices. Panic-driven sentiment dominated, ignoring demand, resulting in an initial surge dominated by a one-sided upward trend.
(II) Mid-March: A sharp decline followed by a pullback, with initial signs of inventory release and demand disruption.
Around March 10-15, there were consecutive or single-day large bearish candles, and prices fell from their highs to the $90-$95 range.
This decline stemmed from the release of the US SPR (Social Reserve Response) and the IEA's coordinated inventory releases, alleviating short-term shortages. High oil prices have already spread to Asia (China and India), with government fuel conservation and refinery production cuts leading to initial signs of fuel shortages. Rumors of easing negotiations triggered profit-taking. The large bearish candlestick signifies a "rational correction after the supply shock," shifting from pure panic to fundamental adjustment.
(III) Late March to early April: A new round of strong upward rebound, with escalating threats looming.
From late March to around April 2, with a large or consecutive positive candlestick, Brent crude oil briefly returned to $107-$113, and even tested higher levels.
Iran continues to threaten new targets, and the US, particularly Trump, has issued an "ultimatum" and made statements regarding strikes against energy facilities. The IEA warns that supply losses in April will be "twice as severe as in March." Actual shutdowns peaked at 9.1 million barrels per day (EIA data), with 5.1 million barrels per day withdrawn from inventories. Tight physical markets coupled with military risks have reignited risk premiums.
(iv) Mid-April: Large bearish candlestick/long upper shadow oscillation, negative report and negotiation expectations suppress the market.
Around the time of the EIA report on April 7 and after the IEA report on April 14, there were obvious bearish candlesticks or candlesticks with upper shadows, and the price fell back to around $96-$103.
Key drivers: The EIA lowered its 2026 demand growth forecast to 600,000 barrels per day, while the IEA directly pointed to a year-on-year consumption decline of 80,000 barrels per day, indicating that high oil prices are creating "demand destruction." Meanwhile, the two-week ceasefire reached on April 7-8 (expiring on April 22) and rumors of negotiations in Islamabad suppressed premiums. Profit-taking combined with report confirmation created natural resistance.
Large bullish candles were almost always driven by sudden supply-side shocks; large bearish candles stemmed from confirmed demand disruptions, easing inventory levels, and expectations of future negotiations. Within a month and a half, the extreme market conditions gradually shifted from a "one-sided supply-driven bull market" to a "tug-of-war between bulls and bears," with trading volume shrinking from its peak, Bollinger Bands narrowing but the range widening—the oscillations were not converging, but rather dynamically expanding.
EIA/IEA report sets the tone: 2026 consumption decline locks in a $120 ceiling.
The EIA's Short-Term Energy Outlook on April 7 and the IEA's Oil Market Report on April 14 became turning points.
The EIA projects Brent crude to peak at $115 per barrel in the second quarter, with an annual average of $96. The IEA further clarifies that the war "completely upends the global oil consumption outlook," with demand contracting by 80,000 barrels per day year-on-year in 2026, primarily due to fuel shortages and high prices in the Middle East and Asia-Pacific. While supply is tight (global supply is shrinking by 1.5 million barrels per day), demand is even weaker, creating a self-perpetuating cycle.
This "decline in consumption" directly corroborates the difficulty in breaking through $120: high oil prices have spread from Asia to the world, refinery operating rates have declined, and government fuel-saving measures have taken effect. The IEA emphasizes that "demand destruction will continue," and the decoupling of physical spot and futures prices (spot prices once reached $150) further confirms that futures cannot sustain pricing of extreme supply because demand is already self-regulating.
Following the report's release, prices rebounded but failed to hold above $105-$110, perfectly confirming the assessment that "$120 is difficult to break through." This is not a short-term disturbance but rather a trend for the entire year of 2026, providing a fundamental anchor for wide-range fluctuations.
Geopolitical tug-of-war continues: the irreconcilable differences between Iran and the United States.
As the conflict entered its sixth week, tensions did not ease but instead turned into a protracted stalemate.
The two-week ceasefire reached on April 7-8 (expiring on April 22) temporarily halted direct conflict, but the Islamabad negotiations (April 11-12) stalled: Iran demanded a comprehensive agreement (including sovereignty over the Straits, asset unfreezing, and a regional ceasefire), while the United States insisted on narrow focus issues (reopening the Straits and the nuclear issue). Although the Trump administration signaled an end to the conflict, its core strategic bottom line remained unchanged; hardline sentiment was high within Iran, with the top leadership repeatedly emphasizing "no compromise."
As Middle East experts agree, the structural contradictions between Iran and the United States are deeply rooted—one side prioritizes nationalist mobilization and regional influence, while the other prioritizes strategic containment. Within certain limits, the probability of alternating escalation and peace talks is far higher than a complete resolution. Uncertainty remains regarding the potential for a Straits blockade, port blockades, and collateral conflict in Lebanon/Israel.
This is precisely the support level for crude oil: any substantial reconciliation would put downward pressure on prices, but the existing contradictions prevent a bottomless collapse, thus forming a dynamic range.
Technical Analysis: Why isn't it a "double top" now?
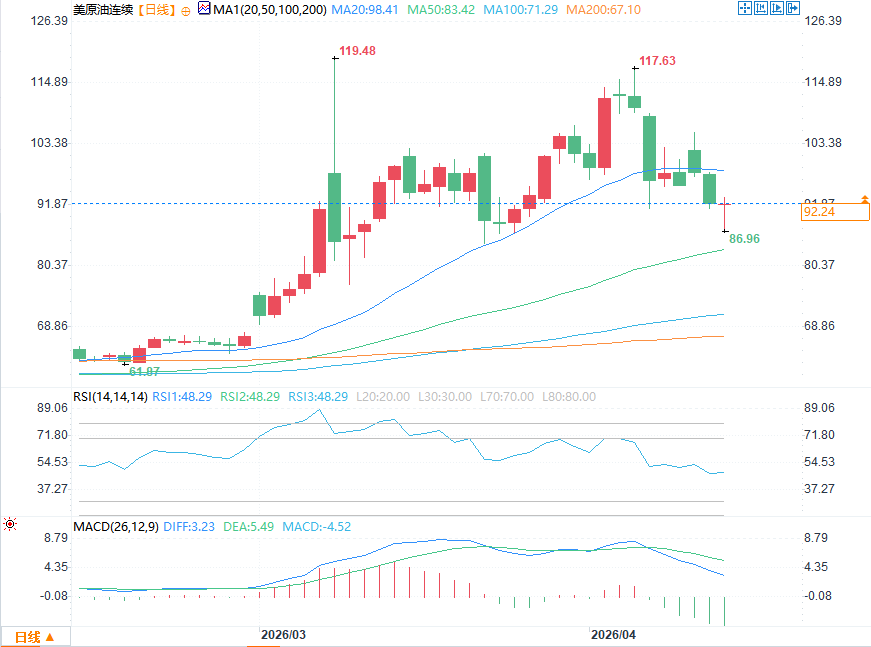
(WTI crude oil daily chart source: FX678)
Some technical analysts believe that the current WTI technical chart shows a double-top pattern: if the current high (March high of $119.50 and the potential April rebound high) fails to break through $120, it could form a classic double top, suggesting that prices will fall back to pre-war levels after the war is "dealt with." This view holds that if the ceasefire is extended, the double top will confirm a bear market reversal.
This view is questionable. The premise for the establishment of a double top is a "rapid and substantial resolution of the war," but the current contradictions between Iran and the United States cannot be bridged, and the protracted negotiations essentially prolong the uncertainty premium.
My framework suggests that the trading range is gradually widening—from an initial $70-100 to the current dynamic range of $90-120+, with fluctuations primarily between $20 and $30. Currently, a wide trading range is more likely to dominate—the interplay of tight supply and weak demand is causing prices to oscillate frequently within a wide range, rather than converging.
Over a longer period, at monthly milestones (such as May 1st): if negotiations make no real progress or the conflict escalates only to a limited extent, prices may rise to even higher points (120+ or even 130 USD), but the demand disruption will quickly pull them back, forming a new upper limit of the "widened range." This is completely different from the "top and fall" of a double top pattern; rather, it is a continuation of the widening range.
The neutral oscillation of MACD/RSI and the shrinking trading volume support this dynamic widening pattern.
Expert opinions align with the logic of range-bound trading.
The latest statements from several authoritative institutions and analysts closely align with the current realities of the crude oil market. Here are some representative viewpoints:
Goldman Sachs lowered its Q2 2026 Brent forecast to $90/barrel due to the two-week ceasefire, but emphasized that if the ceasefire breaks down or Middle East production losses continue to reach 2 million barrels per day, Brent could still rise to $115 in Q4. At the same time, it clearly stated that demand destruction will significantly limit further upside potential for prices.
IEA Chief Economist Fatih Birol stated bluntly that "the Iran war has completely upended the global oil consumption outlook," with high oil prices and supply disruptions triggering "demand destruction." Global oil demand is projected to contract by 80,000 barrels per day year-on-year in 2026, marking the first annual decline since the 2020 pandemic. The demand destruction will spread from Asia and continue to suppress prices.
Analyst polls show that most analysts expect the oil market to turn to a small deficit (averaging about 750,000 barrels per day) in 2026, with the second quarter being the worst and the fourth quarter potentially turning into a surplus. However, overall prices are unlikely to break through the upper limit of the current range, and fluctuations will remain within a wide range.
Vandana Hari, founder of Vanda Insights, pointed out that the "demand destruction" triggered by high prices will quickly suppress any price breakout, the market's optimistic reaction to the ceasefire may be excessive, and the uncertainty caused by the tug-of-war in negotiations will continue to dominate wide-range fluctuations.
ANZ Bank: Emphasizes that permanent capacity losses could reach 2 million barrels per day, but the tug-of-war situation will continue to fluctuate widely. Brent crude is expected to trade above $90 in 2026 before falling back to around $88, showing a clear range-bound trading pattern.
These consensuses collectively confirm that, constrained by both protracted negotiations and declining consumption, a wide-range oscillation pattern with a "ceiling above (unbreakable $120) and a floor below (support at $90-95)" has become the mainstream market assessment. The double-top pattern is merely a hypothetical scenario of a "rapid and substantial resolution of the war," while reality more favors a dynamic widening of the range and a test of higher points every two weeks.
Risk Outlook and Strategy Framework
Baseline scenario: Prices oscillate within a wide range of $90-$120, with high volatility but gradually adapting.
Upside risks: Limited upgrades at the two-week node or worsening supply could lead to testing higher levels.
Downside risk: Substantial settlement news could lead to a recovery in supply expectations, testing the $90 support level.
Investor advice: Employ a range-trading + pivotal trading strategy – reduce positions to lock in profits at $110-$115, and gradually build positions around $95; focus on the defensive attributes of energy stocks and sectors impacted by high oil prices (such as aviation and chemicals). In the long term, a decline in consumption in 2026 may accelerate the energy transition, but short-term geopolitical premiums will still dominate.
Conclusion
A month and a half of extreme candlestick patterns, declining consumption signals from EIA/IEA, and ongoing geopolitical tensions have made it possible that crude oil is currently in a widening, oscillating range. The unresolved tensions between Iran and the US, coupled with ongoing negotiations and attrition, also support the dynamic development of a widening range and testing higher levels. In the face of uncertainty, a clear framework is more important than sentiment—a timeless truth in the energy market.
Amidst ongoing tensions, unresolved structural contradictions between Iran and the United States, and negotiations turning into a war of attrition, crude oil prices have evolved from an initial one-sided supply shock to wide-range fluctuations. Given the extended timeframe (if the conflict remains unresolved by May 1st), crude oil prices may test higher levels, but the dominant trend for the month will likely remain range-bound.
A Month and a Half of War: The Driving Logic Behind Four Rounds of Extreme K-Line Charts
Since the outbreak of the war, Brent crude oil's daily and weekly charts have been filled with numerous significant bullish and bearish candlesticks. These extreme price movements are not random, but rather a precise reflection of supply panic, inventory release, demand disruption, and negotiation expectations.
(I) Late February to early March: Consecutive large positive lines, supply panic and soaring prices
After the US-Israel action was launched on February 28, there were large gains of 8%-13% on March 1-2; after Iran announced the blockade of the Strait of Hormuz on March 4, multiple large gains pushed the price from $72 to $90-$100, and even reached a peak of $119.50.
This was described as "the largest supply disruption in the history of the global oil market" (IEA's original words). Transportation to the Hormuz was paralyzed by 20 million barrels per day, and production shutdowns in the Middle East surged from 7.5 million barrels per day. The market experienced a supply precipitate, leading to a sharp rise in freight and insurance costs, with spot prices reaching $150 per barrel, far exceeding futures prices. Panic-driven sentiment dominated, ignoring demand, resulting in an initial surge dominated by a one-sided upward trend.
(II) Mid-March: A sharp decline followed by a pullback, with initial signs of inventory release and demand disruption.
Around March 10-15, there were consecutive or single-day large bearish candles, and prices fell from their highs to the $90-$95 range.
This decline stemmed from the release of the US SPR (Social Reserve Response) and the IEA's coordinated inventory releases, alleviating short-term shortages. High oil prices have already spread to Asia (China and India), with government fuel conservation and refinery production cuts leading to initial signs of fuel shortages. Rumors of easing negotiations triggered profit-taking. The large bearish candlestick signifies a "rational correction after the supply shock," shifting from pure panic to fundamental adjustment.
(III) Late March to early April: A new round of strong upward rebound, with escalating threats looming.
From late March to around April 2, with a large or consecutive positive candlestick, Brent crude oil briefly returned to $107-$113, and even tested higher levels.
Iran continues to threaten new targets, and the US, particularly Trump, has issued an "ultimatum" and made statements regarding strikes against energy facilities. The IEA warns that supply losses in April will be "twice as severe as in March." Actual shutdowns peaked at 9.1 million barrels per day (EIA data), with 5.1 million barrels per day withdrawn from inventories. Tight physical markets coupled with military risks have reignited risk premiums.
(iv) Mid-April: Large bearish candlestick/long upper shadow oscillation, negative report and negotiation expectations suppress the market.
Around the time of the EIA report on April 7 and after the IEA report on April 14, there were obvious bearish candlesticks or candlesticks with upper shadows, and the price fell back to around $96-$103.
Key drivers: The EIA lowered its 2026 demand growth forecast to 600,000 barrels per day, while the IEA directly pointed to a year-on-year consumption decline of 80,000 barrels per day, indicating that high oil prices are creating "demand destruction." Meanwhile, the two-week ceasefire reached on April 7-8 (expiring on April 22) and rumors of negotiations in Islamabad suppressed premiums. Profit-taking combined with report confirmation created natural resistance.
Large bullish candles were almost always driven by sudden supply-side shocks; large bearish candles stemmed from confirmed demand disruptions, easing inventory levels, and expectations of future negotiations. Within a month and a half, the extreme market conditions gradually shifted from a "one-sided supply-driven bull market" to a "tug-of-war between bulls and bears," with trading volume shrinking from its peak, Bollinger Bands narrowing but the range widening—the oscillations were not converging, but rather dynamically expanding.
EIA/IEA report sets the tone: 2026 consumption decline locks in a $120 ceiling.
The EIA's Short-Term Energy Outlook on April 7 and the IEA's Oil Market Report on April 14 became turning points.
The EIA projects Brent crude to peak at $115 per barrel in the second quarter, with an annual average of $96. The IEA further clarifies that the war "completely upends the global oil consumption outlook," with demand contracting by 80,000 barrels per day year-on-year in 2026, primarily due to fuel shortages and high prices in the Middle East and Asia-Pacific. While supply is tight (global supply is shrinking by 1.5 million barrels per day), demand is even weaker, creating a self-perpetuating cycle.
This "decline in consumption" directly corroborates the difficulty in breaking through $120: high oil prices have spread from Asia to the world, refinery operating rates have declined, and government fuel-saving measures have taken effect. The IEA emphasizes that "demand destruction will continue," and the decoupling of physical spot and futures prices (spot prices once reached $150) further confirms that futures cannot sustain pricing of extreme supply because demand is already self-regulating.
Following the report's release, prices rebounded but failed to hold above $105-$110, perfectly confirming the assessment that "$120 is difficult to break through." This is not a short-term disturbance but rather a trend for the entire year of 2026, providing a fundamental anchor for wide-range fluctuations.
Geopolitical tug-of-war continues: the irreconcilable differences between Iran and the United States.
As the conflict entered its sixth week, tensions did not ease but instead turned into a protracted stalemate.
The two-week ceasefire reached on April 7-8 (expiring on April 22) temporarily halted direct conflict, but the Islamabad negotiations (April 11-12) stalled: Iran demanded a comprehensive agreement (including sovereignty over the Straits, asset unfreezing, and a regional ceasefire), while the United States insisted on narrow focus issues (reopening the Straits and the nuclear issue). Although the Trump administration signaled an end to the conflict, its core strategic bottom line remained unchanged; hardline sentiment was high within Iran, with the top leadership repeatedly emphasizing "no compromise."
As Middle East experts agree, the structural contradictions between Iran and the United States are deeply rooted—one side prioritizes nationalist mobilization and regional influence, while the other prioritizes strategic containment. Within certain limits, the probability of alternating escalation and peace talks is far higher than a complete resolution. Uncertainty remains regarding the potential for a Straits blockade, port blockades, and collateral conflict in Lebanon/Israel.
This is precisely the support level for crude oil: any substantial reconciliation would put downward pressure on prices, but the existing contradictions prevent a bottomless collapse, thus forming a dynamic range.
Technical Analysis: Why isn't it a "double top" now?
(WTI crude oil daily chart source: FX678)
Some technical analysts believe that the current WTI technical chart shows a double-top pattern: if the current high (March high of $119.50 and the potential April rebound high) fails to break through $120, it could form a classic double top, suggesting that prices will fall back to pre-war levels after the war is "dealt with." This view holds that if the ceasefire is extended, the double top will confirm a bear market reversal.
This view is questionable. The premise for the establishment of a double top is a "rapid and substantial resolution of the war," but the current contradictions between Iran and the United States cannot be bridged, and the protracted negotiations essentially prolong the uncertainty premium.
My framework suggests that the trading range is gradually widening—from an initial $70-100 to the current dynamic range of $90-120+, with fluctuations primarily between $20 and $30. Currently, a wide trading range is more likely to dominate—the interplay of tight supply and weak demand is causing prices to oscillate frequently within a wide range, rather than converging.
Over a longer period, at monthly milestones (such as May 1st): if negotiations make no real progress or the conflict escalates only to a limited extent, prices may rise to even higher points (120+ or even 130 USD), but the demand disruption will quickly pull them back, forming a new upper limit of the "widened range." This is completely different from the "top and fall" of a double top pattern; rather, it is a continuation of the widening range.
The neutral oscillation of MACD/RSI and the shrinking trading volume support this dynamic widening pattern.
Expert opinions align with the logic of range-bound trading.
The latest statements from several authoritative institutions and analysts closely align with the current realities of the crude oil market. Here are some representative viewpoints:
Goldman Sachs lowered its Q2 2026 Brent forecast to $90/barrel due to the two-week ceasefire, but emphasized that if the ceasefire breaks down or Middle East production losses continue to reach 2 million barrels per day, Brent could still rise to $115 in Q4. At the same time, it clearly stated that demand destruction will significantly limit further upside potential for prices.
IEA Chief Economist Fatih Birol stated bluntly that "the Iran war has completely upended the global oil consumption outlook," with high oil prices and supply disruptions triggering "demand destruction." Global oil demand is projected to contract by 80,000 barrels per day year-on-year in 2026, marking the first annual decline since the 2020 pandemic. The demand destruction will spread from Asia and continue to suppress prices.
Analyst polls show that most analysts expect the oil market to turn to a small deficit (averaging about 750,000 barrels per day) in 2026, with the second quarter being the worst and the fourth quarter potentially turning into a surplus. However, overall prices are unlikely to break through the upper limit of the current range, and fluctuations will remain within a wide range.
Vandana Hari, founder of Vanda Insights, pointed out that the "demand destruction" triggered by high prices will quickly suppress any price breakout, the market's optimistic reaction to the ceasefire may be excessive, and the uncertainty caused by the tug-of-war in negotiations will continue to dominate wide-range fluctuations.
ANZ Bank: Emphasizes that permanent capacity losses could reach 2 million barrels per day, but the tug-of-war situation will continue to fluctuate widely. Brent crude is expected to trade above $90 in 2026 before falling back to around $88, showing a clear range-bound trading pattern.
These consensuses collectively confirm that, constrained by both protracted negotiations and declining consumption, a wide-range oscillation pattern with a "ceiling above (unbreakable $120) and a floor below (support at $90-95)" has become the mainstream market assessment. The double-top pattern is merely a hypothetical scenario of a "rapid and substantial resolution of the war," while reality more favors a dynamic widening of the range and a test of higher points every two weeks.
Risk Outlook and Strategy Framework
Baseline scenario: Prices oscillate within a wide range of $90-$120, with high volatility but gradually adapting.
Upside risks: Limited upgrades at the two-week node or worsening supply could lead to testing higher levels.
Downside risk: Substantial settlement news could lead to a recovery in supply expectations, testing the $90 support level.
Investor advice: Employ a range-trading + pivotal trading strategy – reduce positions to lock in profits at $110-$115, and gradually build positions around $95; focus on the defensive attributes of energy stocks and sectors impacted by high oil prices (such as aviation and chemicals). In the long term, a decline in consumption in 2026 may accelerate the energy transition, but short-term geopolitical premiums will still dominate.
Conclusion
A month and a half of extreme candlestick patterns, declining consumption signals from EIA/IEA, and ongoing geopolitical tensions have made it possible that crude oil is currently in a widening, oscillating range. The unresolved tensions between Iran and the US, coupled with ongoing negotiations and attrition, also support the dynamic development of a widening range and testing higher levels. In the face of uncertainty, a clear framework is more important than sentiment—a timeless truth in the energy market.
- Risk Warning and Disclaimer
- The market involves risk, and trading may not be suitable for all investors. This article is for reference only and does not constitute personal investment advice, nor does it take into account certain users’ specific investment objectives, financial situation, or other needs. Any investment decisions made based on this information are at your own risk.