Gold's high-level "false breakout" revealed? Dollar weakens, US Treasury yields flat – the market awaits a bombshell!
2026-04-15 20:29:23
On Wednesday (April 15), global financial markets showed a clear improvement in risk appetite. Due to recent signs of easing in geopolitical tensions and a decrease in extreme market concerns about disruptions to Middle Eastern energy transport routes, safe-haven assets generally came under pressure. According to the latest reports from well-known institutions, relevant parties have shown a positive attitude towards resolving regional disputes, particularly with a significant increase in expectations for further diplomatic contact. As a result, US stocks remained near historical highs, while the commodities market showed mixed performance. Although crude oil prices continued to fluctuate due to shipping restrictions, spot gold has fallen significantly from its monthly high. Meanwhile, sentiment in the US Treasury market stabilized, with the 10-year Treasury yield consolidating weakly after hitting recent lows. Overall, the market is in a period of observation before the "shoe drops," with investors closely watching upcoming economic data and the latest statements from monetary policymakers for guidance on the next phase of trends.

After a rapid surge driven by geopolitical risks, spot gold has recently shown clear signs of stagnation. Technically, the 240-minute chart shows that gold prices have fluctuated and retreated after reaching a high of 4871.28, currently trading around 4813.63. Looking at the Bollinger Bands, although the price is trading above the middle band at 4772.74, it has clearly broken away from the upper band's resistance at 4856.19, indicating a weakening of bullish momentum.
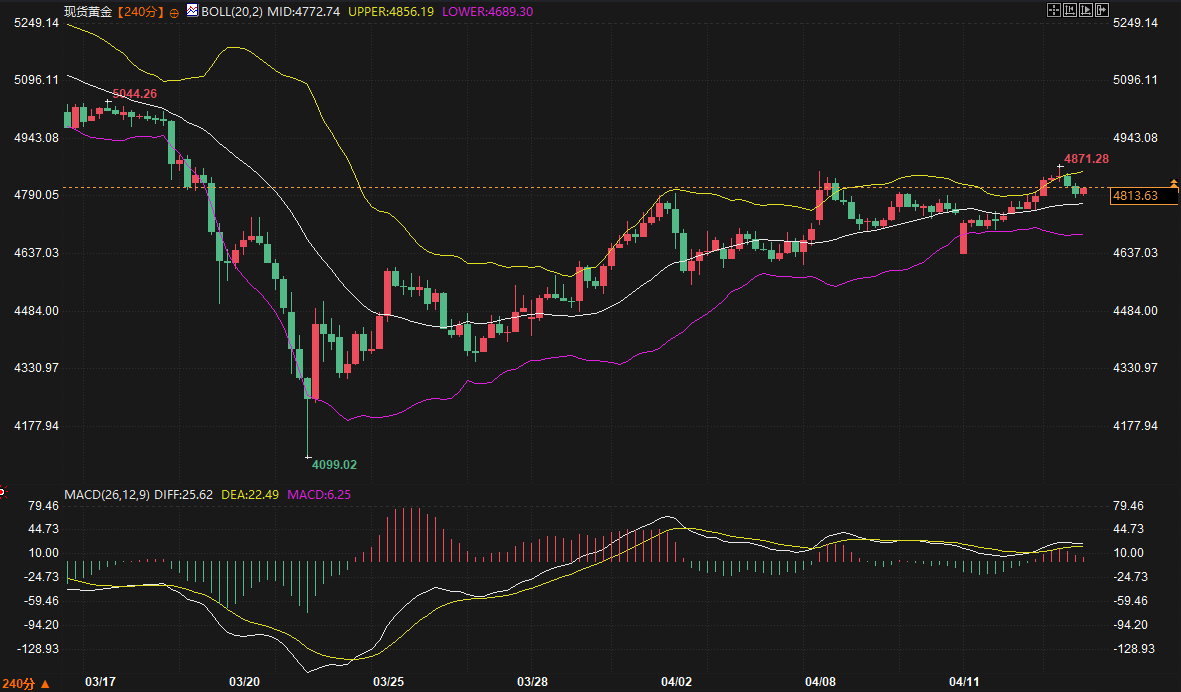
Fundamentally, tariff rhetoric and progress in diplomatic maneuvering in specific regions have significantly weakened gold's safe-haven appeal. Analysts from well-known institutions point out that if these diplomatic contacts resume as scheduled within the next two days, gold prices may further retrace their previous risk premium. Regarding the MACD indicator, although the DIFF and DEA lines remain in positive territory, the red histogram momentum continues to narrow, reflecting strong market divergence above $4800.
In the short term, gold's resistance zone is locked in the 4850-4870 range. This area not only represents the upper Bollinger Band but also a densely populated area of previously trapped positions. The support zone below is referenced to the middle Bollinger Band and the recent densely traded area of 4750-4770. If the geopolitical situation becomes clearer, gold prices may test the 4700 psychological level.
The yield on 10-year US Treasury bonds has been weak recently, maintaining an overall downward trend. The 240-minute chart shows that the yield fluctuated lower after reaching a high of 4.479, currently trading at 4.271. Currently, the price is below the Bollinger Band middle line at 4.291, indicating that bears still dominate.
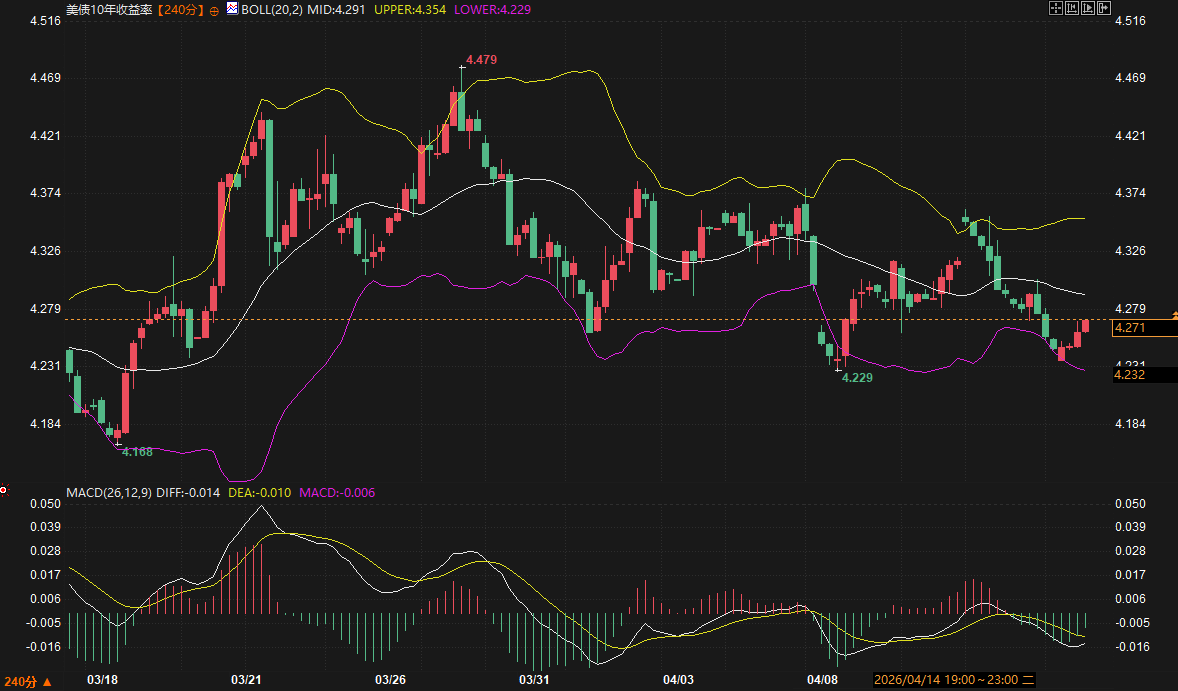
The MACD indicator is flattening below the zero line, with the momentum bars near zero, reflecting a period of relative calm after significant market volatility. Although recent statements from high-level officials suggest that US economic growth is expected to reach 3% to 3.5%, market expectations for a relatively loose monetary policy remain unchanged until actual economic data confirms this. It is worth noting that US Treasury yields are showing some support around 4.229%, which coincides with the lower Bollinger Band.
Over the next 2-3 days, US Treasury yields are expected to remain range-bound between 4.23% and 4.35%. On the upside, the middle band at 4.291 and the upper band at 4.354 present significant resistance; on the downside, a break below 4.22 could trigger a new round of technical selling.
The US Dollar Index (DXY) has been weak recently, dragged down by both waning risk aversion and low yields. On the 240-minute chart, the index is currently trading at 98.2496, well below the previous high of 100.6400. Looking at the Bollinger Bands, the price is trading weakly below the middle band at 98.4852, with the bands widening downwards, indicating that the overall downward channel remains intact.
From a technical perspective, while the MACD fast and slow lines show signs of a bottoming golden cross below the zero line and the momentum bars have turned positive, this reflects more of a weak recovery demand after an oversold condition than a trend reversal. In the short term, the US dollar's resistance zone is located between 98.50 and 99.20, which corresponds to the Bollinger Band's middle to upper band area. Considering the recent withdrawal of safe-haven funds due to easing geopolitical tensions, the US dollar index is unlikely to break through the key resistance level of 99.50 without significant positive support.
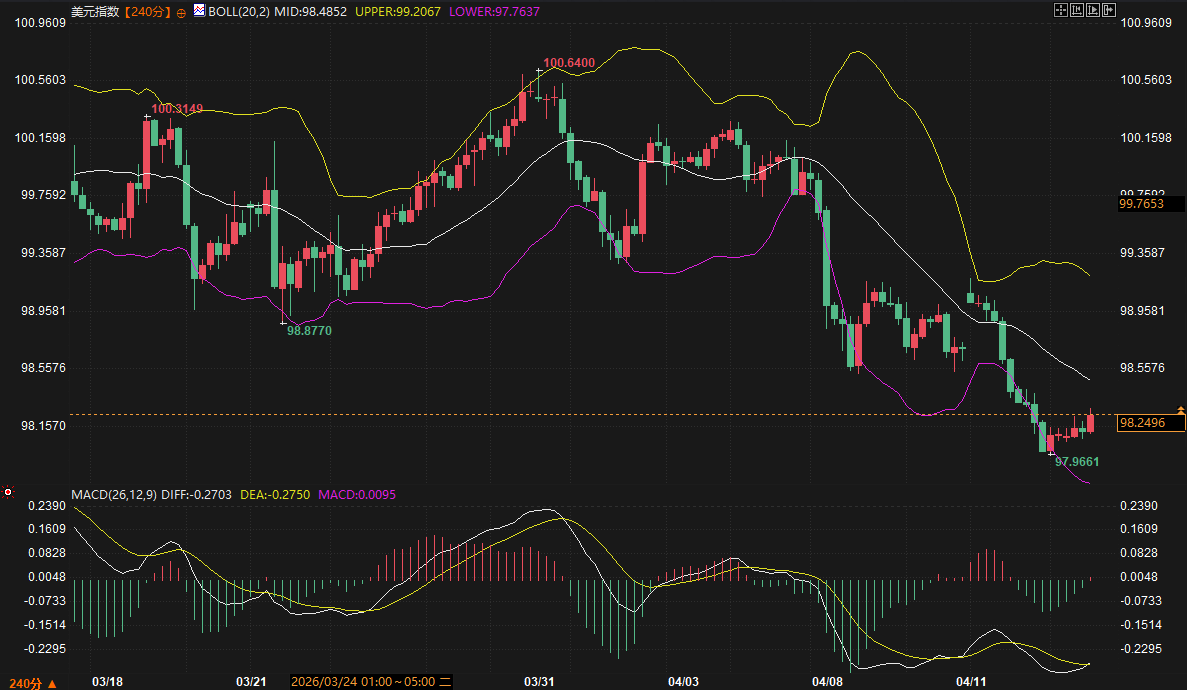
On the downside, the recent low around 97.96 provides some support. In the coming days, with the release of the Beige Book and related manufacturing survey data, if the data falls short of expectations, the US dollar index may continue to explore lower levels.
In summary, the main themes of the market over the next 2-3 trading days will be "risk premium replenishment" and "rebalancing of policy expectations." Spot gold faces significant upward pressure due to potential shifts in geopolitical tensions, and technically, a bearish MACD crossover at high levels could trigger a downward correction. US Treasury yields and the US dollar index are likely to continue their weak and volatile pattern. After digesting previous geopolitical gains, the market will return to focusing on fundamental data. Investors should closely monitor the New York Fed Manufacturing Index and public speeches by financial officials released this Wednesday, as these could be the key catalysts for breaking out of the current trading range.
1. Why did the easing of geopolitical tensions lead to a drop in gold prices?
Gold possesses strong "safe-haven" properties in international financial markets. When uncertainties increase, such as those surrounding the Russia-Ukraine conflict or the Middle East situation, investors buy gold to hedge against risk, driving up premiums. Recent news that the US may resume contact with relevant parties has reduced market concerns about escalating conflicts, causing previously safe-haven funds to exit the market. Consequently, gold prices have seen a significant pullback, a classic example of "buying the rumor, selling the news."
2. What impact does the continued low yield on 10-year US Treasury bonds have on global markets?
The 10-year US Treasury yield is considered an "anchor for global asset pricing." Its weakening typically reflects market concerns about future economic growth momentum or expectations of a shift towards interest rate cuts by the Federal Reserve. Low yields reduce the dollar's interest rate advantage, putting pressure on the dollar index, while simultaneously supporting growth assets and the stock market to some extent. Currently, it is fluctuating around 4.27%, reflecting the market's struggle between strong economic targets and the actual policy path.
3. Is there a high risk that the US dollar index will fall below the 98 mark?
The US dollar index is currently fluctuating narrowly around 98.25. From a technical perspective, the Bollinger Bands are widening downwards and the price is pressured by the middle band, indicating a risk of testing the 98 level. If recent manufacturing survey data is weak, or if risk aversion further dissipates, the dollar may test support around 97.76. However, given the resilient US economic growth expectations, the likelihood of a one-sided collapse in the short term is low.
4. How should we refer to the MACD and Bollinger Bands indicators in the current volatile market?
In the current weak and volatile market, the Bollinger Band's middle band plays a crucial role as a "bull-bear dividing line." Gold prices above the middle band can be considered a strong consolidation, while the US dollar below it indicates a weak bottoming process. For the MACD, attention should be paid to the strength of the momentum bars. For example, a narrowing of the bullish momentum bars in gold often indicates weakening upward momentum, a precursor to a potential shift to sideways trading at higher levels or a pullback.
5. How will the economic data in the next few days affect the price of gold?
Wednesday's release of the Empire State Manufacturing Index and the Beige Book will reveal the latest state of the US real economy. If the data shows that inflationary pressures remain solid, the Federal Reserve may postpone interest rate cuts, which would be bearish for non-interest-bearing gold. Conversely, if the data shows signs of recession, it will strengthen expectations of interest rate cuts, and although gold will be hit by a decline in safe-haven demand, it may find some bottom support under the logic of interest rates.
Easing geopolitical tensions and policy expectations weighed on gold prices.
After a rapid surge driven by geopolitical risks, spot gold has recently shown clear signs of stagnation. Technically, the 240-minute chart shows that gold prices have fluctuated and retreated after reaching a high of 4871.28, currently trading around 4813.63. Looking at the Bollinger Bands, although the price is trading above the middle band at 4772.74, it has clearly broken away from the upper band's resistance at 4856.19, indicating a weakening of bullish momentum.
Fundamentally, tariff rhetoric and progress in diplomatic maneuvering in specific regions have significantly weakened gold's safe-haven appeal. Analysts from well-known institutions point out that if these diplomatic contacts resume as scheduled within the next two days, gold prices may further retrace their previous risk premium. Regarding the MACD indicator, although the DIFF and DEA lines remain in positive territory, the red histogram momentum continues to narrow, reflecting strong market divergence above $4800.
In the short term, gold's resistance zone is locked in the 4850-4870 range. This area not only represents the upper Bollinger Band but also a densely populated area of previously trapped positions. The support zone below is referenced to the middle Bollinger Band and the recent densely traded area of 4750-4770. If the geopolitical situation becomes clearer, gold prices may test the 4700 psychological level.
US Treasury yields are consolidating at low levels.
The yield on 10-year US Treasury bonds has been weak recently, maintaining an overall downward trend. The 240-minute chart shows that the yield fluctuated lower after reaching a high of 4.479, currently trading at 4.271. Currently, the price is below the Bollinger Band middle line at 4.291, indicating that bears still dominate.
The MACD indicator is flattening below the zero line, with the momentum bars near zero, reflecting a period of relative calm after significant market volatility. Although recent statements from high-level officials suggest that US economic growth is expected to reach 3% to 3.5%, market expectations for a relatively loose monetary policy remain unchanged until actual economic data confirms this. It is worth noting that US Treasury yields are showing some support around 4.229%, which coincides with the lower Bollinger Band.
Over the next 2-3 days, US Treasury yields are expected to remain range-bound between 4.23% and 4.35%. On the upside, the middle band at 4.291 and the upper band at 4.354 present significant resistance; on the downside, a break below 4.22 could trigger a new round of technical selling.
The US dollar index's rebound was weak, and it remained in a downward channel.
The US Dollar Index (DXY) has been weak recently, dragged down by both waning risk aversion and low yields. On the 240-minute chart, the index is currently trading at 98.2496, well below the previous high of 100.6400. Looking at the Bollinger Bands, the price is trading weakly below the middle band at 98.4852, with the bands widening downwards, indicating that the overall downward channel remains intact.
From a technical perspective, while the MACD fast and slow lines show signs of a bottoming golden cross below the zero line and the momentum bars have turned positive, this reflects more of a weak recovery demand after an oversold condition than a trend reversal. In the short term, the US dollar's resistance zone is located between 98.50 and 99.20, which corresponds to the Bollinger Band's middle to upper band area. Considering the recent withdrawal of safe-haven funds due to easing geopolitical tensions, the US dollar index is unlikely to break through the key resistance level of 99.50 without significant positive support.
On the downside, the recent low around 97.96 provides some support. In the coming days, with the release of the Beige Book and related manufacturing survey data, if the data falls short of expectations, the US dollar index may continue to explore lower levels.
Future Outlook
In summary, the main themes of the market over the next 2-3 trading days will be "risk premium replenishment" and "rebalancing of policy expectations." Spot gold faces significant upward pressure due to potential shifts in geopolitical tensions, and technically, a bearish MACD crossover at high levels could trigger a downward correction. US Treasury yields and the US dollar index are likely to continue their weak and volatile pattern. After digesting previous geopolitical gains, the market will return to focusing on fundamental data. Investors should closely monitor the New York Fed Manufacturing Index and public speeches by financial officials released this Wednesday, as these could be the key catalysts for breaking out of the current trading range.
Frequently Asked Questions
1. Why did the easing of geopolitical tensions lead to a drop in gold prices?
Gold possesses strong "safe-haven" properties in international financial markets. When uncertainties increase, such as those surrounding the Russia-Ukraine conflict or the Middle East situation, investors buy gold to hedge against risk, driving up premiums. Recent news that the US may resume contact with relevant parties has reduced market concerns about escalating conflicts, causing previously safe-haven funds to exit the market. Consequently, gold prices have seen a significant pullback, a classic example of "buying the rumor, selling the news."
2. What impact does the continued low yield on 10-year US Treasury bonds have on global markets?
The 10-year US Treasury yield is considered an "anchor for global asset pricing." Its weakening typically reflects market concerns about future economic growth momentum or expectations of a shift towards interest rate cuts by the Federal Reserve. Low yields reduce the dollar's interest rate advantage, putting pressure on the dollar index, while simultaneously supporting growth assets and the stock market to some extent. Currently, it is fluctuating around 4.27%, reflecting the market's struggle between strong economic targets and the actual policy path.
3. Is there a high risk that the US dollar index will fall below the 98 mark?
The US dollar index is currently fluctuating narrowly around 98.25. From a technical perspective, the Bollinger Bands are widening downwards and the price is pressured by the middle band, indicating a risk of testing the 98 level. If recent manufacturing survey data is weak, or if risk aversion further dissipates, the dollar may test support around 97.76. However, given the resilient US economic growth expectations, the likelihood of a one-sided collapse in the short term is low.
4. How should we refer to the MACD and Bollinger Bands indicators in the current volatile market?
In the current weak and volatile market, the Bollinger Band's middle band plays a crucial role as a "bull-bear dividing line." Gold prices above the middle band can be considered a strong consolidation, while the US dollar below it indicates a weak bottoming process. For the MACD, attention should be paid to the strength of the momentum bars. For example, a narrowing of the bullish momentum bars in gold often indicates weakening upward momentum, a precursor to a potential shift to sideways trading at higher levels or a pullback.
5. How will the economic data in the next few days affect the price of gold?
Wednesday's release of the Empire State Manufacturing Index and the Beige Book will reveal the latest state of the US real economy. If the data shows that inflationary pressures remain solid, the Federal Reserve may postpone interest rate cuts, which would be bearish for non-interest-bearing gold. Conversely, if the data shows signs of recession, it will strengthen expectations of interest rate cuts, and although gold will be hit by a decline in safe-haven demand, it may find some bottom support under the logic of interest rates.
- Risk Warning and Disclaimer
- The market involves risk, and trading may not be suitable for all investors. This article is for reference only and does not constitute personal investment advice, nor does it take into account certain users’ specific investment objectives, financial situation, or other needs. Any investment decisions made based on this information are at your own risk.