The US dollar index has taken a sharp turn, yields have retreated, and gold is facing a bearish onslaught alone at the $4871 high.
2026-04-16 20:04:38
On Thursday (April 16), global commodity and foreign exchange markets showed significant signs of risk appetite recovery. With positive signs of de-escalation emerging in the Middle East, previously high inflation expectations eased marginally. Investors' expectations for the Federal Reserve to cut interest rates by at least 25 basis points by the end of 2026 have risen to 34%. This shift in sentiment directly weakened safe-haven buying of the US dollar. Meanwhile, as falling energy prices reduced long-term inflation costs, non-interest-bearing assets such as gold, after experiencing significant volatility, began to seek support near a new equilibrium point.

Recent developments in the Middle East have become the core logic influencing the market. Although reports indicate that the passage of some sanctioned vessels through the Strait of Hormuz remains uncertain, the market as a whole tends to accept the initial diplomatic consensus reached against the backdrop of tariff rhetoric. This optimism has led to crude oil prices recovering from a drop of about 1% today, but they remain under pressure below the $90 mark.
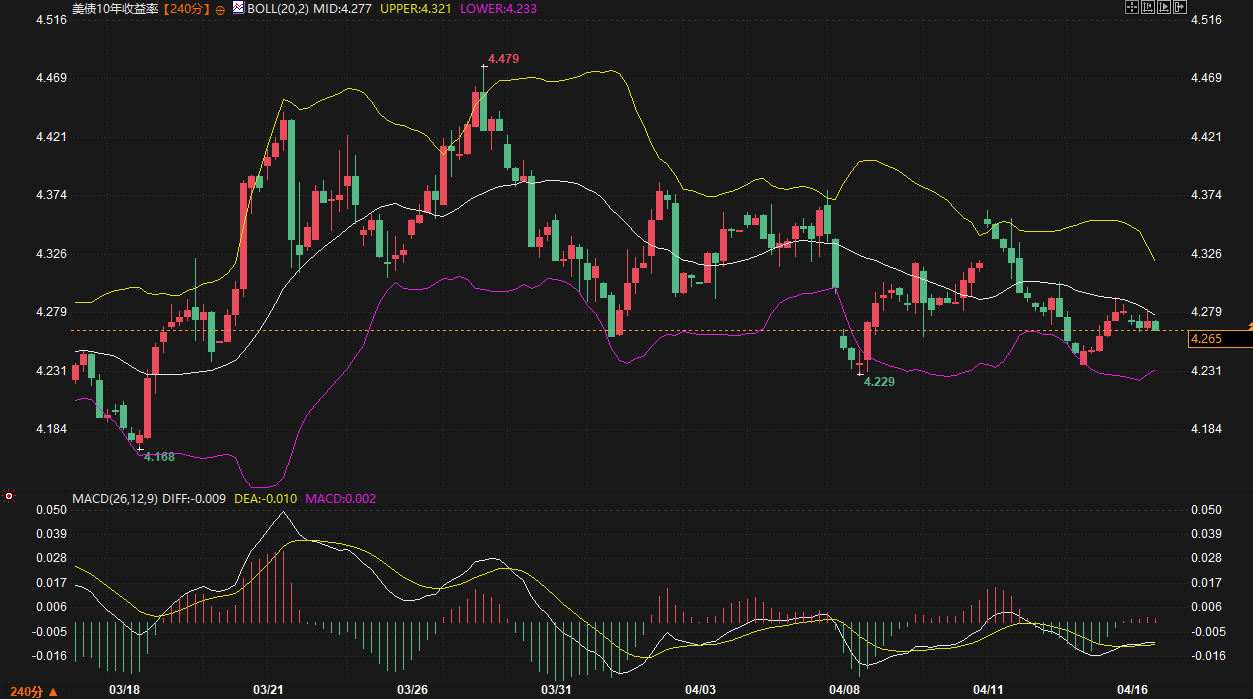
From a fundamental perspective, the surge and subsequent decline in oil prices directly alleviated imported inflationary pressures on major economies. A well-known institution pointed out that the decline in energy costs has led the market to reassess the Federal Reserve's policy path, and the surge in liquidity demand previously driven by concerns about an energy crisis has largely subsided. Reflecting this in the bond market, the 10-year US Treasury yield entered a period of consolidation and decline after reaching a high of 4.479%. Currently, the 240-minute chart shows the yield hovering around 4.265%, constrained by the Bollinger Band's middle line at 4.277%. Although the bearish momentum has weakened due to the MACD indicator's DIFF crossing above the DEA to form a very weak golden cross, the bond market remains weak within the 4.23%-4.35% range, providing breathing room for a rebound in gold prices.
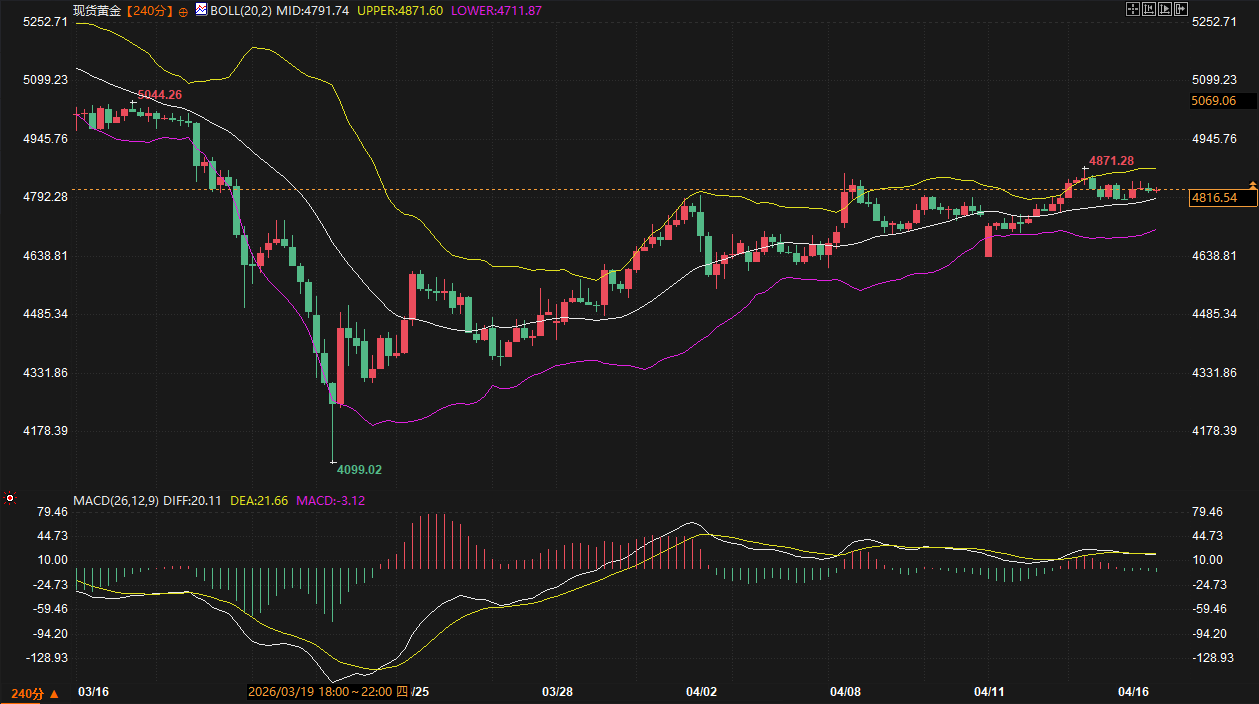
After hitting a record high of $5,044.26 in mid-March, spot gold experienced a sharp sell-off due to rising expectations of interest rate hikes fueled by inflation concerns, falling as low as $4,099.02. Subsequently, after fully digesting the negative news, the market staged a strong V-shaped reversal.
On the 240-minute candlestick chart, spot gold is currently trading around $4816.54, above the Bollinger Band middle line at $4791.74, indicating that the short-term trend remains resilient. However, technical concerns are emerging: the MACD histogram continues to contract, and while the DIFF and DEA lines are above the zero line, the momentum of the red bars is weakening, suggesting that the momentum of this rebound from the lows is waning and there is a potential risk of a top divergence. In the next 2-3 days, gold will face key resistance in the $4871.28 to $4871.60 range. If it fails to break through with significant volume, the price may retrace to the Bollinger Band middle line at $4791 to seek support. Considering the current general rise in global risk assets, gold's appeal as a safe-haven asset may be somewhat suppressed in the short term.
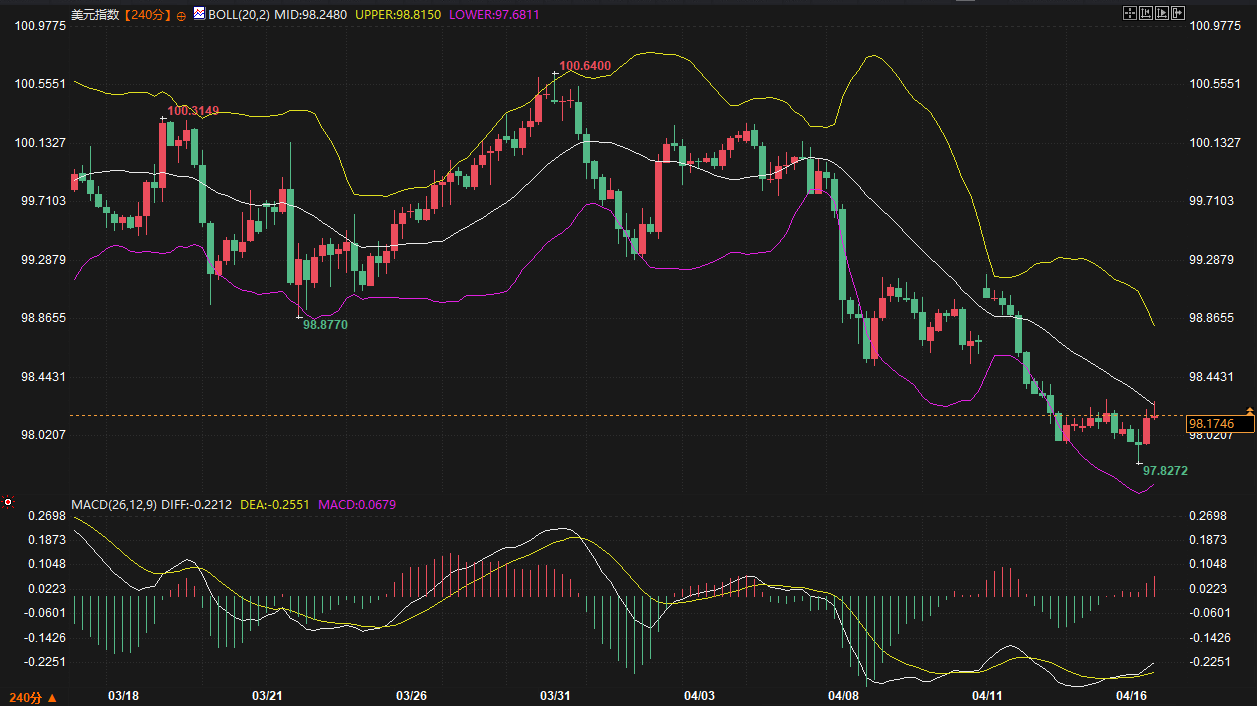
The US dollar index has recently shown a clear negative correlation with gold. After reaching a high of 100.64 at the end of March, the dollar index experienced a one-sided decline. Fundamentally, with optimistic expectations regarding the Middle East situation and moderate manufacturing data, the "safe-haven premium" of the dollar index is being eliminated.
From a technical perspective, the US dollar index is currently fluctuating around 98.1746, within a low-level consolidation range of 97.8 to 98.5. The 240-minute indicator shows that the MACD golden cross is expanding, with the red bars continuing to grow, indicating that the momentum for a short-term oversold rebound is accumulating. The Bollinger Band middle line at 98.2480 is the first resistance level; if it can effectively hold above this level, the rebound target will be near the upper Bollinger Band at 98.8150 . Support below is firmly locked at the previous low of 97.8272 . Overall, given the expected weaker-than-expected US jobless claims and Philadelphia Fed manufacturing index data, the dollar's rebound is likely to be volatile, probably testing the upper resistance level in a slow, oscillating upward movement.
In summary, the market will enter a correction period in the "post-geopolitical crisis" over the next 2-3 days. Spot gold , approaching the area below its previous high, faces technical pullback pressure due to momentum divergence and is expected to find direction within a wide range of $4711 to $4871. The US dollar index has shown initial rebound signals after touching its previous support level, but its rebound is expected to be limited by the decline in US Treasury yields. The key point to watch is whether it can break through the resistance level of 98.25.
For the crude oil market, the stability of navigation in the Strait of Hormuz remains a potential disruptive factor. However, before substantial progress is made in diplomatic negotiations, oil prices are likely to remain weak and consolidate below $100. Overall, the market focus is shifting from simple geopolitical risk aversion to the repricing of economic fundamentals. Investors need to pay close attention to the industrial production data released tonight and the latest statements from Federal Reserve officials.
1. What is the logic behind the latest developments in the Middle East situation affecting gold prices?
The market is currently optimistic about a potential reconciliation in the Middle East. Logically, the de-escalation of the situation weakens gold's "safe-haven" attribute, leading to an outflow of safe-haven funds. On the other hand, the improved situation has caused oil prices to fall, lowering inflation expectations and reopening the Federal Reserve's room for future interest rate cuts. These two forces are offsetting each other in the short term, resulting in gold exhibiting wide-range fluctuations at high levels rather than a one-sided upward trend.
2. Why did the US dollar not fall sharply despite the decline in US Treasury yields?
Although the 10-year US Treasury yield has fallen from its highs due to the easing of tensions, the US dollar index had previously experienced a significant one-sided decline, and currently there is a strong technical demand for a rebound from oversold levels. Furthermore, Europe continues to face economic pressure due to increased defense spending and energy security issues, while the US economy is relatively resilient. This "interest rate differential logic" has supported the stabilization of the US dollar around 97.82.
3. What are the technical resistance levels for spot gold around $4,871?
This resistance level is formed by the upper Bollinger Band and the previous high point during the V-shaped reversal. Looking at the 240-minute MACD indicator, the price is making new highs while the indicator momentum is weakening, forming a typical technical divergence. This means that in the absence of new major geopolitical catalysts, selling pressure in this area will significantly increase.
4. How should we interpret the recent US manufacturing and employment data for market guidance?
The upcoming initial jobless claims and Philadelphia Fed manufacturing survey are key indicators of whether the US economy has been affected by the situation. If the data is weaker than expected (e.g., the Philadelphia Fed index falls below 10.0), it will further strengthen expectations of interest rate cuts, which typically suppresses the dollar and supports the bond market. However, if the job market remains robust, the dollar's rebound momentum will be further confirmed.
5. Why does the analysis mention that the passage conditions in the Strait of Hormuz remain important?
While diplomatic rhetoric leans towards optimism, well-known institutions have detected that some sanctioned vessels are still using unconventional means to pass through, and the blockade has not been completely lifted. This means that the "alarm" regarding energy supply has not yet been completely dispelled. In the event of unexpected friction, crude oil prices could retest $100, at which point inflation concerns will return, potentially reversing the current trends in the bond and gold markets.
Easing geopolitical tensions are driving a convergence of energy and inflation expectations.
Recent developments in the Middle East have become the core logic influencing the market. Although reports indicate that the passage of some sanctioned vessels through the Strait of Hormuz remains uncertain, the market as a whole tends to accept the initial diplomatic consensus reached against the backdrop of tariff rhetoric. This optimism has led to crude oil prices recovering from a drop of about 1% today, but they remain under pressure below the $90 mark.
From a fundamental perspective, the surge and subsequent decline in oil prices directly alleviated imported inflationary pressures on major economies. A well-known institution pointed out that the decline in energy costs has led the market to reassess the Federal Reserve's policy path, and the surge in liquidity demand previously driven by concerns about an energy crisis has largely subsided. Reflecting this in the bond market, the 10-year US Treasury yield entered a period of consolidation and decline after reaching a high of 4.479%. Currently, the 240-minute chart shows the yield hovering around 4.265%, constrained by the Bollinger Band's middle line at 4.277%. Although the bearish momentum has weakened due to the MACD indicator's DIFF crossing above the DEA to form a very weak golden cross, the bond market remains weak within the 4.23%-4.35% range, providing breathing room for a rebound in gold prices.
Spot gold: V-shaped recovery after the pullback from the highs and technical pressure.
After hitting a record high of $5,044.26 in mid-March, spot gold experienced a sharp sell-off due to rising expectations of interest rate hikes fueled by inflation concerns, falling as low as $4,099.02. Subsequently, after fully digesting the negative news, the market staged a strong V-shaped reversal.
On the 240-minute candlestick chart, spot gold is currently trading around $4816.54, above the Bollinger Band middle line at $4791.74, indicating that the short-term trend remains resilient. However, technical concerns are emerging: the MACD histogram continues to contract, and while the DIFF and DEA lines are above the zero line, the momentum of the red bars is weakening, suggesting that the momentum of this rebound from the lows is waning and there is a potential risk of a top divergence. In the next 2-3 days, gold will face key resistance in the $4871.28 to $4871.60 range. If it fails to break through with significant volume, the price may retrace to the Bollinger Band middle line at $4791 to seek support. Considering the current general rise in global risk assets, gold's appeal as a safe-haven asset may be somewhat suppressed in the short term.
US Dollar Index: Signs of Bottoming Out and Rebound, and Analysis of Key Resistance Levels
The US dollar index has recently shown a clear negative correlation with gold. After reaching a high of 100.64 at the end of March, the dollar index experienced a one-sided decline. Fundamentally, with optimistic expectations regarding the Middle East situation and moderate manufacturing data, the "safe-haven premium" of the dollar index is being eliminated.
From a technical perspective, the US dollar index is currently fluctuating around 98.1746, within a low-level consolidation range of 97.8 to 98.5. The 240-minute indicator shows that the MACD golden cross is expanding, with the red bars continuing to grow, indicating that the momentum for a short-term oversold rebound is accumulating. The Bollinger Band middle line at 98.2480 is the first resistance level; if it can effectively hold above this level, the rebound target will be near the upper Bollinger Band at 98.8150 . Support below is firmly locked at the previous low of 97.8272 . Overall, given the expected weaker-than-expected US jobless claims and Philadelphia Fed manufacturing index data, the dollar's rebound is likely to be volatile, probably testing the upper resistance level in a slow, oscillating upward movement.
Future Outlook
In summary, the market will enter a correction period in the "post-geopolitical crisis" over the next 2-3 days. Spot gold , approaching the area below its previous high, faces technical pullback pressure due to momentum divergence and is expected to find direction within a wide range of $4711 to $4871. The US dollar index has shown initial rebound signals after touching its previous support level, but its rebound is expected to be limited by the decline in US Treasury yields. The key point to watch is whether it can break through the resistance level of 98.25.
For the crude oil market, the stability of navigation in the Strait of Hormuz remains a potential disruptive factor. However, before substantial progress is made in diplomatic negotiations, oil prices are likely to remain weak and consolidate below $100. Overall, the market focus is shifting from simple geopolitical risk aversion to the repricing of economic fundamentals. Investors need to pay close attention to the industrial production data released tonight and the latest statements from Federal Reserve officials.
Frequently Asked Questions
1. What is the logic behind the latest developments in the Middle East situation affecting gold prices?
The market is currently optimistic about a potential reconciliation in the Middle East. Logically, the de-escalation of the situation weakens gold's "safe-haven" attribute, leading to an outflow of safe-haven funds. On the other hand, the improved situation has caused oil prices to fall, lowering inflation expectations and reopening the Federal Reserve's room for future interest rate cuts. These two forces are offsetting each other in the short term, resulting in gold exhibiting wide-range fluctuations at high levels rather than a one-sided upward trend.
2. Why did the US dollar not fall sharply despite the decline in US Treasury yields?
Although the 10-year US Treasury yield has fallen from its highs due to the easing of tensions, the US dollar index had previously experienced a significant one-sided decline, and currently there is a strong technical demand for a rebound from oversold levels. Furthermore, Europe continues to face economic pressure due to increased defense spending and energy security issues, while the US economy is relatively resilient. This "interest rate differential logic" has supported the stabilization of the US dollar around 97.82.
3. What are the technical resistance levels for spot gold around $4,871?
This resistance level is formed by the upper Bollinger Band and the previous high point during the V-shaped reversal. Looking at the 240-minute MACD indicator, the price is making new highs while the indicator momentum is weakening, forming a typical technical divergence. This means that in the absence of new major geopolitical catalysts, selling pressure in this area will significantly increase.
4. How should we interpret the recent US manufacturing and employment data for market guidance?
The upcoming initial jobless claims and Philadelphia Fed manufacturing survey are key indicators of whether the US economy has been affected by the situation. If the data is weaker than expected (e.g., the Philadelphia Fed index falls below 10.0), it will further strengthen expectations of interest rate cuts, which typically suppresses the dollar and supports the bond market. However, if the job market remains robust, the dollar's rebound momentum will be further confirmed.
5. Why does the analysis mention that the passage conditions in the Strait of Hormuz remain important?
While diplomatic rhetoric leans towards optimism, well-known institutions have detected that some sanctioned vessels are still using unconventional means to pass through, and the blockade has not been completely lifted. This means that the "alarm" regarding energy supply has not yet been completely dispelled. In the event of unexpected friction, crude oil prices could retest $100, at which point inflation concerns will return, potentially reversing the current trends in the bond and gold markets.
- Risk Warning and Disclaimer
- The market involves risk, and trading may not be suitable for all investors. This article is for reference only and does not constitute personal investment advice, nor does it take into account certain users’ specific investment objectives, financial situation, or other needs. Any investment decisions made based on this information are at your own risk.