Gold prices are hovering around $4,700; will it break through or break down?
2026-04-23 19:37:22
On Thursday (April 23), during the European session, spot gold opened higher but trended lower throughout the day, with prices suppressed by the intraday moving average. It weakened again towards the close and is currently at its intraday low, indicating an overall bearish bias. It opened higher at around $4740, reaching a high of around $4750 before fluctuating downwards, falling to a low of around $4690 by the close. As of 18:41 Beijing time, it was trading at $4699.67, with an intraday range of approximately $60.

In the short term, gold prices are facing a challenging period, as the precious metal has failed to accumulate enough momentum to sustain a solid bullish trend. In fact, gold prices have fallen by nearly 2.00% in the past three trading days, reflecting market hesitation amid a mix of fundamental and technical factors.
Geopolitical stalemate and market sentiment: a double-edged sword of safe-haven demand
From a market fundamentals perspective, the complex evolution of the situation in the Middle East has become the core variable influencing the demand for precious metals. On the one hand, US President Trump has indefinitely extended the US-Iran ceasefire agreement and facilitated Pakistan's involvement in mediation. This development has temporarily alleviated market concerns about escalating conflict, pushing the CNN Fear & Greed Index to continue rising. Currently, the reading is approaching the "extreme greed" threshold of 75 points, causing some funds to flow back into risk assets and weakening the safe-haven buying support for gold.
On the other hand, the second round of peace talks has stalled, with Iran making it clear that it will refuse to participate in the talks until the US lifts its maritime blockade. The standoff between the two sides over the Strait of Hormuz continues to escalate. Iran has recently taken several actions in the strait, including seizing ships and firing warning shots, which has led to the risk of supply disruptions for about one-fifth of global maritime crude oil transport. Brent crude oil prices have broken through $101 per barrel, and concerns about energy inflation have provided some safety margin for gold.
This geopolitical landscape, characterized by both easing expectations and risk premiums, has led to a more cautious investor sentiment. Data shows that while gold ETFs maintained net inflows in April, the growth rate has slowed significantly, and Asian markets showed clear signs of profit-taking when gold prices reached around $4,850, reflecting a lack of sustained willingness to allocate to safe-haven assets.
Meanwhile, the moderate weakening of the US dollar index (down 0.2% on the day) provided slight support for dollar-denominated gold, but the high volatility of US Treasury yields due to expectations of a Fed rate hike (the 10-year US Treasury yield remained stable at around 4.3%) continued to suppress the upside potential of gold.
Gold: On the Eve of a Breakout from a Compressed Range
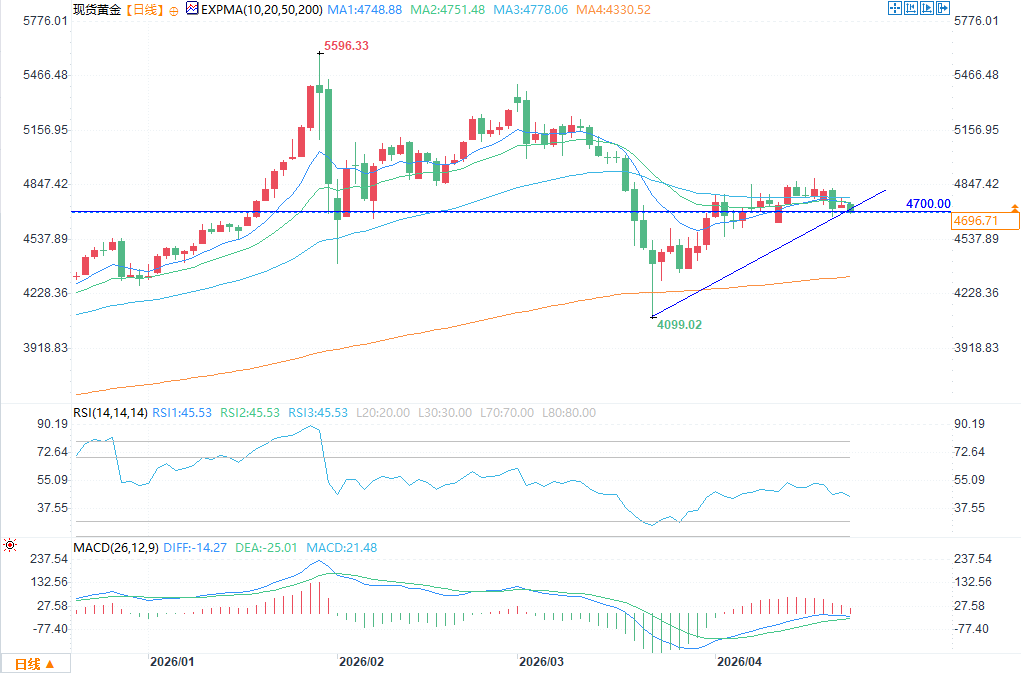
(Spot gold daily chart source: FX678)
From a technical perspective, XAU/USD is currently in a crucial consolidation phase, with the price consolidating in a narrow range around $4706, supported by a solid support zone between $4690 and $4700. Since the price failed to hold above the $4800 level, the candlestick pattern has exhibited characteristics of "small bodies and long shadows," fully reflecting the stalemate between bulls and bears.
It is worth noting that the upward trend line formed at the end of March is still playing a dynamic support role, while the 50-day and 200-day exponential moving averages (EMAs) are flattening out near the current price, sending a clear neutral signal that the market is at a critical point of "consolidation and breakout".
Momentum indicators also confirm this judgment: the Relative Strength Index (RSI) has fallen back to the 45-50 range, a significant drop from the previous high, indicating that the previous bullish momentum is rapidly dissipating; the MACD indicator histogram is fluctuating around the zero axis, and the short-term moving averages are converging with the long-term moving averages, further confirming the current neutral pattern.
From a key price level perspective, if gold prices break below the $4,690 support level, it could trigger stop-loss orders and a chain reaction, with the next target pointing to $4,600, or even the previous low of $4,570. Conversely, if it can recover the $4,800 psychological level, it will open up upward potential towards $4,890 and even the psychological level of $5,000. However, we need to be wary of profit-taking pressure near $5,000 – previous attempts to break through this price level have all failed, indicating strong resistance at this level.
Market Outlook
In summary, gold is currently in a pattern of "short-term consolidation, with the long-term trend unchanged." Its future direction will primarily depend on three key variables: first, the progress of US-Iran peace talks and the situation in the Strait of Hormuz. Escalating conflict and pushing up oil prices would strengthen the safe-haven and inflation-hedging demand for precious metals; second, expectations regarding Federal Reserve policy and the trend of US Treasury yields. If the 10-year US Treasury yield falls below 4.0%, it would significantly reduce the cost of holding gold; and third, physical demand and capital flows. Continued gold purchases by global central banks (net purchases of 215 tons in Q1 2026) and the continued inflow of funds into ETFs remain the core fundamental factors supporting gold prices.
For investors, the key focus for gold is the breakout direction from the $4690-$4800 trading range. A breakout would allow them to follow the trend. However, they should also be wary of unforeseen risks such as energy price volatility and shifts in global central bank policies, and should manage their positions carefully and set stop-loss orders accordingly.
In the short term, gold prices are facing a challenging period, as the precious metal has failed to accumulate enough momentum to sustain a solid bullish trend. In fact, gold prices have fallen by nearly 2.00% in the past three trading days, reflecting market hesitation amid a mix of fundamental and technical factors.
Geopolitical stalemate and market sentiment: a double-edged sword of safe-haven demand
From a market fundamentals perspective, the complex evolution of the situation in the Middle East has become the core variable influencing the demand for precious metals. On the one hand, US President Trump has indefinitely extended the US-Iran ceasefire agreement and facilitated Pakistan's involvement in mediation. This development has temporarily alleviated market concerns about escalating conflict, pushing the CNN Fear & Greed Index to continue rising. Currently, the reading is approaching the "extreme greed" threshold of 75 points, causing some funds to flow back into risk assets and weakening the safe-haven buying support for gold.
On the other hand, the second round of peace talks has stalled, with Iran making it clear that it will refuse to participate in the talks until the US lifts its maritime blockade. The standoff between the two sides over the Strait of Hormuz continues to escalate. Iran has recently taken several actions in the strait, including seizing ships and firing warning shots, which has led to the risk of supply disruptions for about one-fifth of global maritime crude oil transport. Brent crude oil prices have broken through $101 per barrel, and concerns about energy inflation have provided some safety margin for gold.
This geopolitical landscape, characterized by both easing expectations and risk premiums, has led to a more cautious investor sentiment. Data shows that while gold ETFs maintained net inflows in April, the growth rate has slowed significantly, and Asian markets showed clear signs of profit-taking when gold prices reached around $4,850, reflecting a lack of sustained willingness to allocate to safe-haven assets.
Meanwhile, the moderate weakening of the US dollar index (down 0.2% on the day) provided slight support for dollar-denominated gold, but the high volatility of US Treasury yields due to expectations of a Fed rate hike (the 10-year US Treasury yield remained stable at around 4.3%) continued to suppress the upside potential of gold.
Gold: On the Eve of a Breakout from a Compressed Range
(Spot gold daily chart source: FX678)
From a technical perspective, XAU/USD is currently in a crucial consolidation phase, with the price consolidating in a narrow range around $4706, supported by a solid support zone between $4690 and $4700. Since the price failed to hold above the $4800 level, the candlestick pattern has exhibited characteristics of "small bodies and long shadows," fully reflecting the stalemate between bulls and bears.
It is worth noting that the upward trend line formed at the end of March is still playing a dynamic support role, while the 50-day and 200-day exponential moving averages (EMAs) are flattening out near the current price, sending a clear neutral signal that the market is at a critical point of "consolidation and breakout".
Momentum indicators also confirm this judgment: the Relative Strength Index (RSI) has fallen back to the 45-50 range, a significant drop from the previous high, indicating that the previous bullish momentum is rapidly dissipating; the MACD indicator histogram is fluctuating around the zero axis, and the short-term moving averages are converging with the long-term moving averages, further confirming the current neutral pattern.
From a key price level perspective, if gold prices break below the $4,690 support level, it could trigger stop-loss orders and a chain reaction, with the next target pointing to $4,600, or even the previous low of $4,570. Conversely, if it can recover the $4,800 psychological level, it will open up upward potential towards $4,890 and even the psychological level of $5,000. However, we need to be wary of profit-taking pressure near $5,000 – previous attempts to break through this price level have all failed, indicating strong resistance at this level.
Market Outlook
In summary, gold is currently in a pattern of "short-term consolidation, with the long-term trend unchanged." Its future direction will primarily depend on three key variables: first, the progress of US-Iran peace talks and the situation in the Strait of Hormuz. Escalating conflict and pushing up oil prices would strengthen the safe-haven and inflation-hedging demand for precious metals; second, expectations regarding Federal Reserve policy and the trend of US Treasury yields. If the 10-year US Treasury yield falls below 4.0%, it would significantly reduce the cost of holding gold; and third, physical demand and capital flows. Continued gold purchases by global central banks (net purchases of 215 tons in Q1 2026) and the continued inflow of funds into ETFs remain the core fundamental factors supporting gold prices.
For investors, the key focus for gold is the breakout direction from the $4690-$4800 trading range. A breakout would allow them to follow the trend. However, they should also be wary of unforeseen risks such as energy price volatility and shifts in global central bank policies, and should manage their positions carefully and set stop-loss orders accordingly.
- Risk Warning and Disclaimer
- The market involves risk, and trading may not be suitable for all investors. This article is for reference only and does not constitute personal investment advice, nor does it take into account certain users’ specific investment objectives, financial situation, or other needs. Any investment decisions made based on this information are at your own risk.