The Real Battlefield Under the Fog of Iran: A 4.34% Yield Ambush on Gold Prices, the 4683 Defense Line Imminent.
2026-04-23 20:28:55
On Thursday (April 23), global financial markets exhibited high volatility amid complex macroeconomic dynamics. With the geopolitical stalemate and structural risks on the oil supply side, commodity and currency markets are at a critical pricing window. In the current "neither war nor peace" context, concerns about navigation safety in the Strait of Hormuz have caused Brent crude to return above the $100 mark. This surge in energy prices has directly translated into inflation expectations, causing US Treasury yields to climb, and consequently putting significant pricing pressure on non-interest-bearing assets such as spot gold. Currently, market sentiment is oscillating between recession fears and sticky inflation. In the short term, the strong position of the US dollar, coupled with rising yields, is redefining cross-asset liquidity allocation, and overall volatility remains high.

According to the latest industry information, the crude oil market is currently in an extremely sensitive state due to policy guidance related to tariffs and the ongoing blockade of Middle Eastern shipping routes. Technically, the near-month crude oil contract shows a clear bullish pattern. Although profit-taking occurred recently around $97.22 due to a potential double-top formation, causing prices to fall below $94, the overall upward trend line remains intact.
From a fundamental perspective, the prolonged blockade of key shipping lanes has directly driven up energy costs. Renowned institutions point out that this strategic stalemate not only supports oil prices but also raises the risk of a global economic contraction. If high oil prices persist, global growth may fall to 2% in 2026, undoubtedly exacerbating market risk aversion. However, this risk aversion has not flowed into gold but has instead been reflected in the bond market due to inflation concerns. In terms of resistance levels, crude oil is currently facing upward pressure from $ 98.00 to $119.00 ; while support lies in the $ 87.00 to $91.80 range, with the Bollinger Band middle line at $91.85 being a key point to observe for the shift in bullish and bearish forces. Short-term price action is expected to be mainly range-bound at high levels, with the possibility of a second test of higher levels driven by positive news.
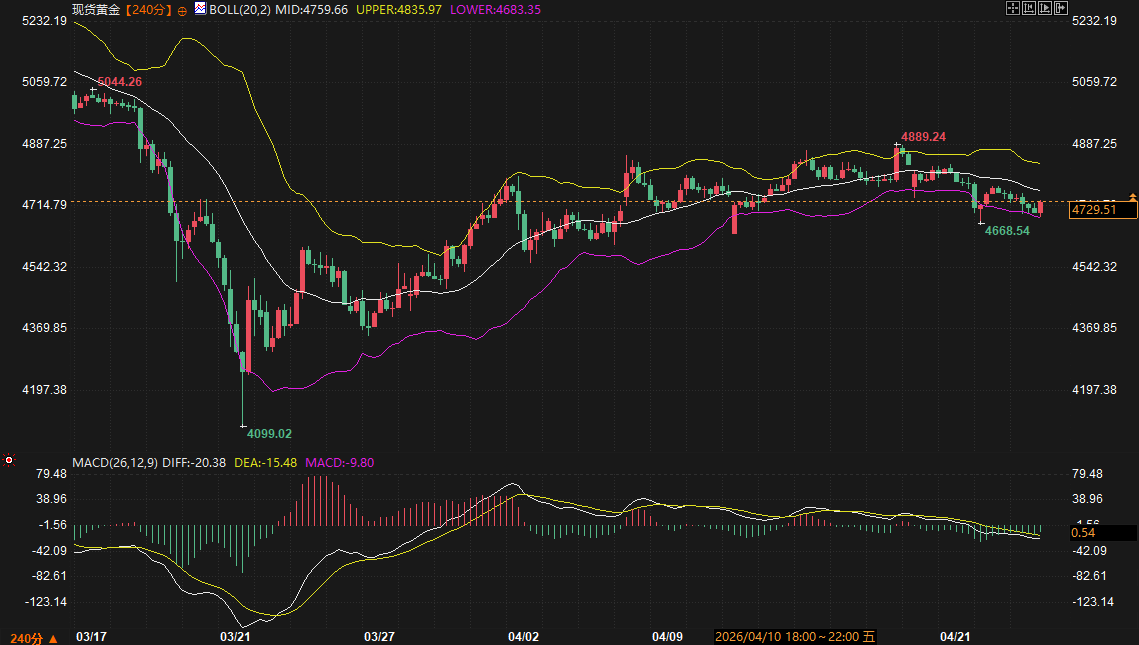
Spot gold is showing a clear pullback pattern on the 240-minute chart. Currently priced at around 4729.51, it's in the weak zone between the Bollinger Band's middle band (4759.66) and lower band (4683.35). The MACD indicator shows both the DIFF and DEA lines below the zero line, and the green bars continue to expand, suggesting that bearish momentum dominates in the short term. Although the narrowing of the histogram suggests a weakening of downward momentum, there's a lack of sufficient bullish reversal signals.
Gold prices are under pressure from both rising inflation and persistently high interest rates. While gold possesses safe-haven attributes, with the 10-year US Treasury yield rising to around 4.340% and opportunity costs increasing significantly, investors are more inclined to hold the US dollar or higher-yielding assets. Technical analysis shows that gold faces significant resistance in the 4835.00-4890.00 range. In the short term, if it fails to stabilize above the 4700 level, the price is highly likely to test the lower Bollinger Band at 4683.00 and the previous support level around 4660.00 . Until the Fed enters a period of observation and geopolitical tensions deteriorate further, gold is expected to maintain a weak consolidation pattern.
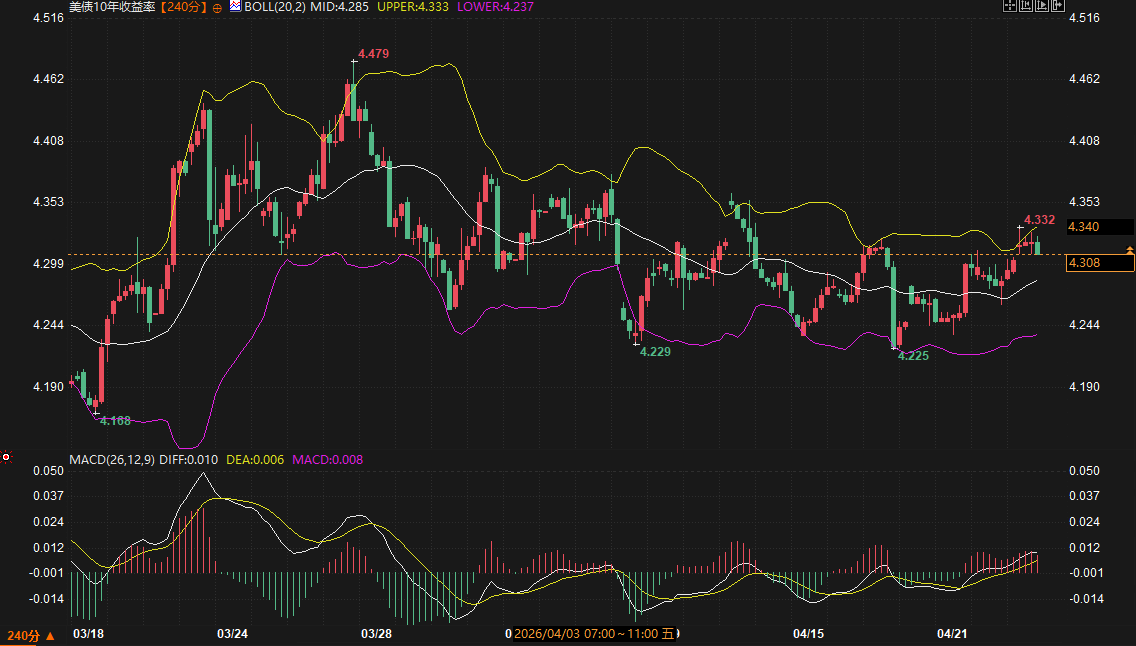
The 10-year US Treasury yield has recently shown strong upward momentum, with the latest quote reaching 4.340%. On the 240-minute chart, the MACD has formed a golden cross, and the price is trading between the Bollinger Band's middle band (4.285) and upper band (4.333), demonstrating a clear bullish trend. A survey by a well-known institution indicates that the Fed's interest rate cut window may be delayed by six months due to the inflation rebound triggered by the energy shock; this expectation gap directly supports the dollar's exchange rate performance.
Observing the chart, yields are facing temporary resistance in the 4.330-4.350 range. If the market further confirms a rebound in inflation driven by a robust economy with the release of Thursday's unemployment claims or PMI survey data, yields are expected to break through the resistance and move towards the previous high of 4.479 . Conversely, if the data shows signs of recession, yields may retreat to the 4.220-4.237 range to find support. Currently, the positive correlation between the US dollar and yields is extremely strong, and this "dual strength" pattern will remain the main factor suppressing gold prices in the next 2-3 trading days.
Taking both fundamental and technical factors into account, the market is expected to exhibit a pattern of "energy prices maintaining a premium, US Treasury yields consolidating at high levels, and gold bottoming out at low levels" over the next 2-3 trading days. Due to geopolitical uncertainties, the crude oil market will continue to act as an inflation leader, and its fluctuation range of $87 to $98 will directly determine the frequency of bond market volatility. Spot gold lacks upward momentum in the short term; the key level to watch is the effectiveness of the $4683 support level. A break below this level could open up further downside potential. The US dollar's short-term strength, supported by both safe-haven demand and interest rate advantages, is unlikely to be disproven.
1. Why has the price of gold fallen despite recent geopolitical tensions?
Typically, geopolitical instability boosts gold prices, but the current core logic lies in the soaring energy prices triggering strong inflation expectations. These expectations have forced a significant rise in US Treasury yields and convinced the market that interest rates will remain high for an extended period. For gold, a non-interest-bearing asset, the increased holding costs due to high yields have outweighed its safe-haven appeal, causing gold prices to passively decline amid a rising dollar and yield environment.
2. What specific negative impacts will future crude oil price trends have on the global economy?
According to predictions from well-known institutions, if crude oil prices remain above $100 for an extended period due to shipping lane blockades, global GDP growth could decline from the baseline of 3.1% to 2.0%. This risk of stagflation would exacerbate the contraction in manufacturing (such as production cuts in the European aviation industry) and lead to a surge in end-consumer costs. Against this backdrop, market concerns about an economic recession will gradually intensify.
3. In the current technical pattern of gold, which price levels are most noteworthy?
In the 240-minute timeframe, the key support zone is between 4683 and 4700. If the closing price breaks below the lower Bollinger Band at 4683, the level of 4668 and even lower will be threatened. Resistance for any rebound is mainly concentrated at the middle Bollinger Band at 4759 and the previous rebound high of 4889. Until the MACD indicator returns above the zero line, any rebound is likely to be seen as a technical correction rather than a trend reversal.
4. What implications do changes in the 10-year US Treasury yield have for individual investors?
Yields climbing above 4.34% indicates a return of funds to low-risk, fixed-income assets. This will not only depress the performance of commodities (gold, silver) but also suppress valuations in global stock markets by raising discount rates. Investors should pay attention to the PMI and employment data released this Thursday; if the data is stronger than expected, yields could push further into the 4.47% range.
5. How do tariff rhetoric and the current "neither war nor peace" stance affect the foreign exchange market?
This situation creates a highly uncertain policy environment. Tariff rhetoric tends to boost the safe-haven appeal of the dollar, while geopolitically driven energy inflation supports the Fed maintaining a hawkish stance. Under this dual logic, the dollar's strength against non-dollar currencies is expected to persist. As long as the blockade of the Strait of Hormuz remains in place, this supply-side driven dollar strength will have strong endogenous momentum.
Crude Oil: A Game Between Geopolitical Premiums and Contraction Risks
According to the latest industry information, the crude oil market is currently in an extremely sensitive state due to policy guidance related to tariffs and the ongoing blockade of Middle Eastern shipping routes. Technically, the near-month crude oil contract shows a clear bullish pattern. Although profit-taking occurred recently around $97.22 due to a potential double-top formation, causing prices to fall below $94, the overall upward trend line remains intact.
From a fundamental perspective, the prolonged blockade of key shipping lanes has directly driven up energy costs. Renowned institutions point out that this strategic stalemate not only supports oil prices but also raises the risk of a global economic contraction. If high oil prices persist, global growth may fall to 2% in 2026, undoubtedly exacerbating market risk aversion. However, this risk aversion has not flowed into gold but has instead been reflected in the bond market due to inflation concerns. In terms of resistance levels, crude oil is currently facing upward pressure from $ 98.00 to $119.00 ; while support lies in the $ 87.00 to $91.80 range, with the Bollinger Band middle line at $91.85 being a key point to observe for the shift in bullish and bearish forces. Short-term price action is expected to be mainly range-bound at high levels, with the possibility of a second test of higher levels driven by positive news.
Spot gold: A technical pullback in a high-yield environment
Spot gold is showing a clear pullback pattern on the 240-minute chart. Currently priced at around 4729.51, it's in the weak zone between the Bollinger Band's middle band (4759.66) and lower band (4683.35). The MACD indicator shows both the DIFF and DEA lines below the zero line, and the green bars continue to expand, suggesting that bearish momentum dominates in the short term. Although the narrowing of the histogram suggests a weakening of downward momentum, there's a lack of sufficient bullish reversal signals.
Gold prices are under pressure from both rising inflation and persistently high interest rates. While gold possesses safe-haven attributes, with the 10-year US Treasury yield rising to around 4.340% and opportunity costs increasing significantly, investors are more inclined to hold the US dollar or higher-yielding assets. Technical analysis shows that gold faces significant resistance in the 4835.00-4890.00 range. In the short term, if it fails to stabilize above the 4700 level, the price is highly likely to test the lower Bollinger Band at 4683.00 and the previous support level around 4660.00 . Until the Fed enters a period of observation and geopolitical tensions deteriorate further, gold is expected to maintain a weak consolidation pattern.
US Treasury yields: Strong market conditions squeeze market space
The 10-year US Treasury yield has recently shown strong upward momentum, with the latest quote reaching 4.340%. On the 240-minute chart, the MACD has formed a golden cross, and the price is trading between the Bollinger Band's middle band (4.285) and upper band (4.333), demonstrating a clear bullish trend. A survey by a well-known institution indicates that the Fed's interest rate cut window may be delayed by six months due to the inflation rebound triggered by the energy shock; this expectation gap directly supports the dollar's exchange rate performance.
Observing the chart, yields are facing temporary resistance in the 4.330-4.350 range. If the market further confirms a rebound in inflation driven by a robust economy with the release of Thursday's unemployment claims or PMI survey data, yields are expected to break through the resistance and move towards the previous high of 4.479 . Conversely, if the data shows signs of recession, yields may retreat to the 4.220-4.237 range to find support. Currently, the positive correlation between the US dollar and yields is extremely strong, and this "dual strength" pattern will remain the main factor suppressing gold prices in the next 2-3 trading days.
Future Outlook
Taking both fundamental and technical factors into account, the market is expected to exhibit a pattern of "energy prices maintaining a premium, US Treasury yields consolidating at high levels, and gold bottoming out at low levels" over the next 2-3 trading days. Due to geopolitical uncertainties, the crude oil market will continue to act as an inflation leader, and its fluctuation range of $87 to $98 will directly determine the frequency of bond market volatility. Spot gold lacks upward momentum in the short term; the key level to watch is the effectiveness of the $4683 support level. A break below this level could open up further downside potential. The US dollar's short-term strength, supported by both safe-haven demand and interest rate advantages, is unlikely to be disproven.
Frequently Asked Questions
1. Why has the price of gold fallen despite recent geopolitical tensions?
Typically, geopolitical instability boosts gold prices, but the current core logic lies in the soaring energy prices triggering strong inflation expectations. These expectations have forced a significant rise in US Treasury yields and convinced the market that interest rates will remain high for an extended period. For gold, a non-interest-bearing asset, the increased holding costs due to high yields have outweighed its safe-haven appeal, causing gold prices to passively decline amid a rising dollar and yield environment.
2. What specific negative impacts will future crude oil price trends have on the global economy?
According to predictions from well-known institutions, if crude oil prices remain above $100 for an extended period due to shipping lane blockades, global GDP growth could decline from the baseline of 3.1% to 2.0%. This risk of stagflation would exacerbate the contraction in manufacturing (such as production cuts in the European aviation industry) and lead to a surge in end-consumer costs. Against this backdrop, market concerns about an economic recession will gradually intensify.
3. In the current technical pattern of gold, which price levels are most noteworthy?
In the 240-minute timeframe, the key support zone is between 4683 and 4700. If the closing price breaks below the lower Bollinger Band at 4683, the level of 4668 and even lower will be threatened. Resistance for any rebound is mainly concentrated at the middle Bollinger Band at 4759 and the previous rebound high of 4889. Until the MACD indicator returns above the zero line, any rebound is likely to be seen as a technical correction rather than a trend reversal.
4. What implications do changes in the 10-year US Treasury yield have for individual investors?
Yields climbing above 4.34% indicates a return of funds to low-risk, fixed-income assets. This will not only depress the performance of commodities (gold, silver) but also suppress valuations in global stock markets by raising discount rates. Investors should pay attention to the PMI and employment data released this Thursday; if the data is stronger than expected, yields could push further into the 4.47% range.
5. How do tariff rhetoric and the current "neither war nor peace" stance affect the foreign exchange market?
This situation creates a highly uncertain policy environment. Tariff rhetoric tends to boost the safe-haven appeal of the dollar, while geopolitically driven energy inflation supports the Fed maintaining a hawkish stance. Under this dual logic, the dollar's strength against non-dollar currencies is expected to persist. As long as the blockade of the Strait of Hormuz remains in place, this supply-side driven dollar strength will have strong endogenous momentum.
- Risk Warning and Disclaimer
- The market involves risk, and trading may not be suitable for all investors. This article is for reference only and does not constitute personal investment advice, nor does it take into account certain users’ specific investment objectives, financial situation, or other needs. Any investment decisions made based on this information are at your own risk.