US Treasury yields approach 4.35%, gold defends $4650: Consumer confidence plummets, major changes looming during interest rate FOMC silence?
2026-04-24 20:03:19
On Friday (April 24), global financial markets exhibited a clear mix of risk aversion and inflation expectations . Crude oil prices surged, nearing the $98 mark, influenced by recent escalation in geopolitical tensions. This led to a volatile upward trend in US Treasury yields and the US dollar index, while spot gold experienced a technical correction after a significant earlier rally. With the Federal Reserve currently in a blackout period following its interest rate meeting next week, market focus is on today's University of Michigan Consumer Sentiment Index. Preliminary data shows that consumer confidence is at a historical low, influenced by rising inflation expectations due to the situation. This macroeconomic backdrop sets a complex tone for short-term volatility in commodity and foreign exchange markets.

The crude oil market is currently at a critical juncture of tug-of-war between bulls and bears. Fundamentally, recent tariff pronouncements and expectations of their implementation, along with directives to block shipping in specific regions, have significantly increased the geopolitical risk premium in the energy market. Leading institutions point out that the US's interception operations targeting specific "shadow fleets" and its directives to strike forces near the Strait of Hormuz have increased market concerns about potential crude oil supply disruptions. Although no substantial physical supply gap has yet materialized, the increased probability of such potential interception and confrontation has created a solid floor for oil prices.
From a technical perspective, the recent pullback in the main crude oil contract to the support range around $93 and $94 indicates strong buying interest. The chart shows a clear "double top" pattern, but catalyzed by geopolitical factors, the market is building momentum to break through the $100 mark. Logically, as long as the blockade and standoff in the relevant regions continue, the downside for oil prices will be limited. In the next 2-3 days, close attention should be paid to whether there are further military contacts in the relevant waters, as this will be the key variable determining whether oil prices can break through the $100 mark.
The US dollar index recently rebounded after touching support at 97.62 and is currently hovering around 98.60. The 240-minute chart shows that the price has broken above the Bollinger Band's middle line and is attempting to break through the upper band at 98.95. The moving average system (MA1 and MA50) is in a bullish alignment, indicating a short-term bullish trend. Although the MACD indicator is running above the zero line, the red bars are narrowing slightly, suggesting a slight weakening of upward momentum, and the market is exhibiting caution before the strong resistance zone of 98.90 to 99.00.
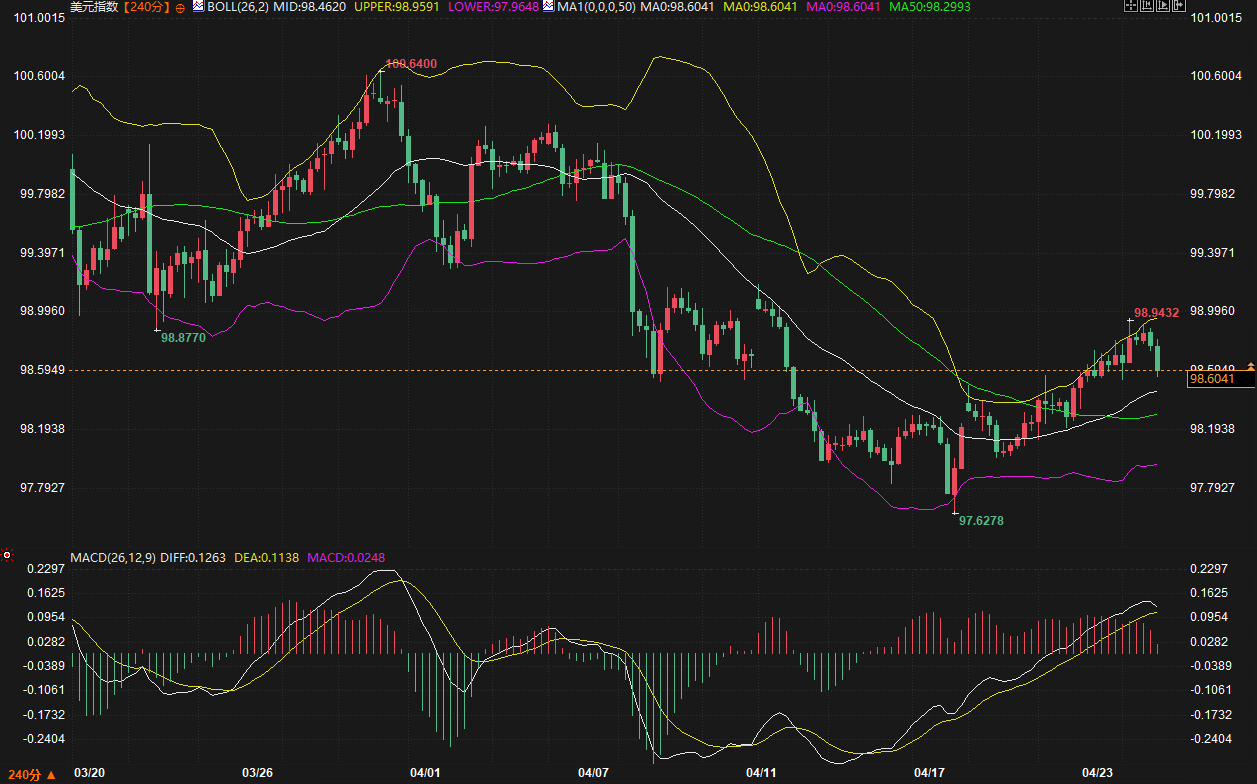
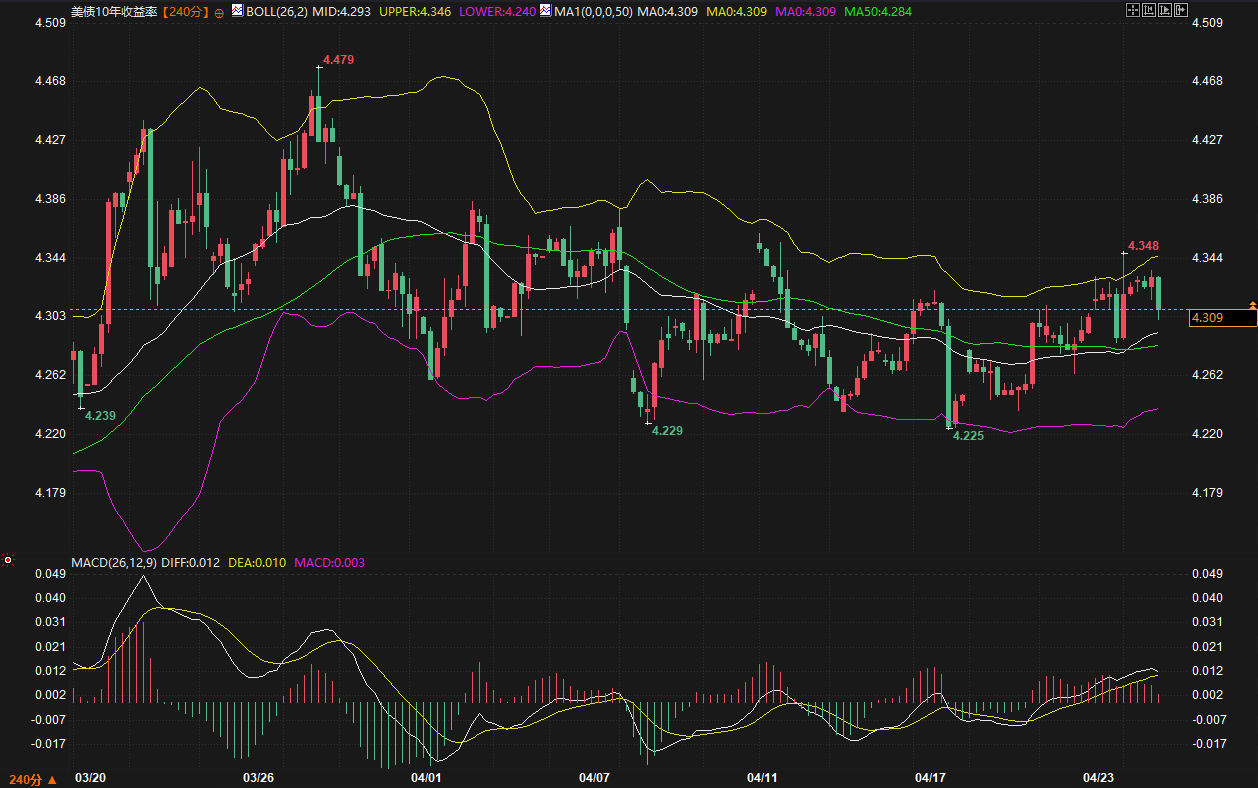
Correspondingly, the 10-year US Treasury yield is fluctuating around 4.31%. Technically, the 4.34% to 4.35% range has formed a short-term double top resistance, and the MACD fast and slow lines are converging, indicating a temporary balance between bullish and bearish forces. Due to low consumer confidence and high inflation expectations, US Treasury yields are unlikely to fall significantly. In the next 2-3 days, the US dollar index is expected to maintain a slightly bullish trend between 98.20 and 99.00. If oil prices continue to rise, driving up inflation expectations, the dollar may test its previous high; otherwise, it may retrace to the strong support level around 98.25.
The price movement of spot gold has diverged somewhat from that of crude oil and the US dollar. After reaching a high of $4,899 in late March, gold prices are currently in a clear downward channel. Currently priced around $4,708, the price is trading below all moving averages, indicating an extremely bearish technical outlook. The MACD histogram continues to expand below the zero line, suggesting that selling pressure has not yet fully dissipated.
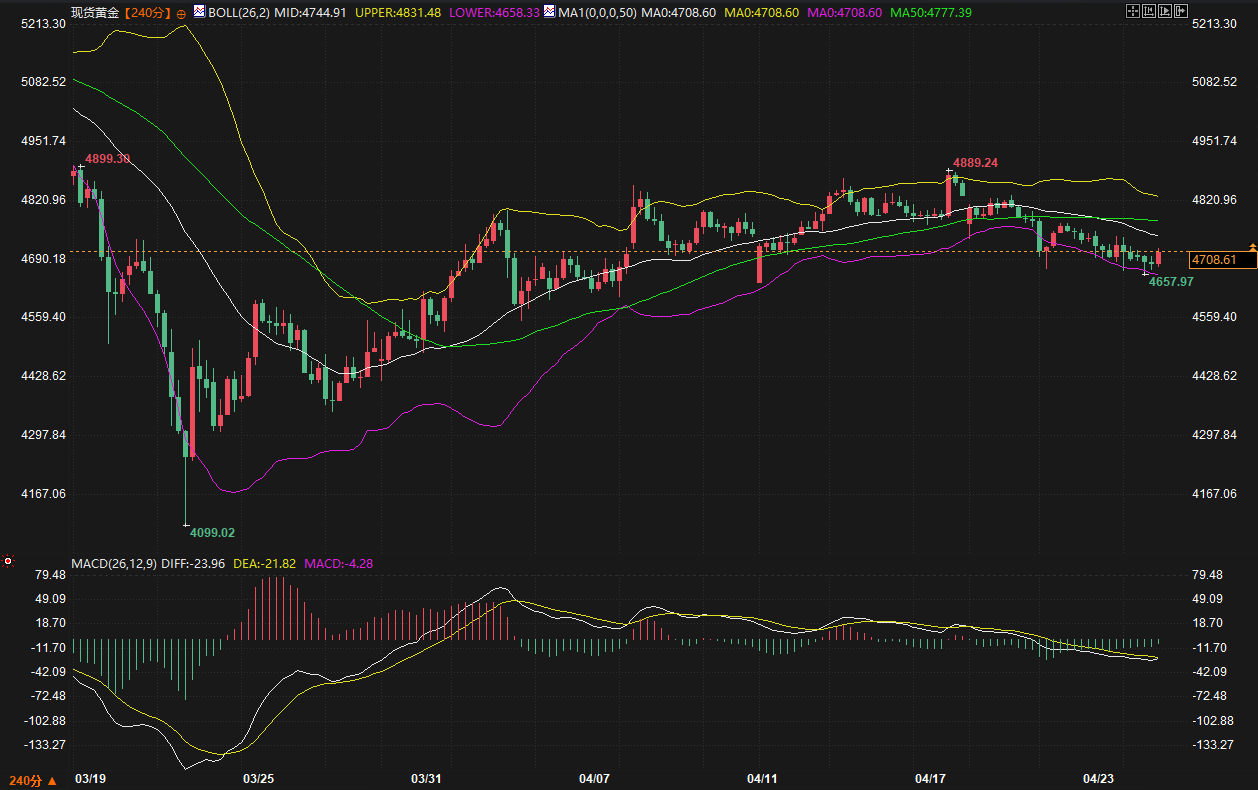
While the Russia-Ukraine situation and tensions in the Middle East provide a long-term safe-haven appeal for gold, its price is under significant pressure in the short term due to a stronger dollar and stabilizing US Treasury yields. The $4650 level is currently a key support zone in the short term; a break below this level could lead to further declines. Conversely, the $4750-$4800 range presents significant resistance. Logically, gold is currently in a phase of confluence between weakening safe-haven demand and technical correction, and is expected to consolidate or fluctuate weakly within the $4650-$4750 range over the next 2-3 days.
In summary, the main theme of the market over the next 2-3 trading days will be "continued volatility driven by geopolitical conflicts." Crude oil prices, influenced by policy directives and interception actions, possess strong upward potential, and their movement will serve as a barometer of global risk appetite. The US dollar index, supported by a technical rebound and inflation expectations, will remain strong in the short term. Gold, however, needs to wait for signs of stabilization after the bearish momentum weakens. Overall market sentiment remains fragile, and investors must be highly vigilant about the instantaneous impact of sudden geopolitical news on asset prices. Until key levels such as 4.35% (US Treasury yield) and 99.00 (US dollar index) are effectively broken, the market will likely maintain its current range-bound trading pattern.
1. Why has the price of gold been weak despite recent geopolitical tensions?
A: While the Russia-Ukraine situation and Middle East tensions have created safe-haven demand, the market's primary pricing logic is currently more influenced by the US dollar and real interest rates. The rebound in the US dollar index and the high levels of US Treasury yields have increased the opportunity cost of holding gold. Furthermore, after gold prices reached historical highs, there is significant profit-taking in the market, and technical correction pressures have masked some safe-haven buying, leading to a temporary weakness in gold prices.
2. What is the specific path of the impact of tariff rhetoric on crude oil prices?
A: Tariff rhetoric is often accompanied by tougher diplomatic and trade policies. In this round of volatility, it is directly reflected in the severe crackdown on energy exports from specific countries. By intercepting "shadow fleets" and monitoring key waterways, this policy expectation directly reduces market confidence in the stability of global crude oil supply, thereby incorporating the "risk premium" into oil prices and supporting crude oil prices above $93.
3. What challenges does the US dollar index face at the 99.00 level?
A: This level was a significant resistance point in the previous period. Currently, although technical indicators are bullish, the narrowing of the MACD histogram reflects some hesitation among bulls at higher levels. If today's University of Michigan consumer sentiment index falls short of expectations, it may reflect public concerns about the economic outlook under high inflation, thus limiting the dollar's further upward momentum in the short term.
4. What does the current trend in US Treasury yields indicate for ordinary investors?
A: The repeated fluctuations of the 10-year US Treasury yield around 4.30% indicate a divergence in market opinions regarding the long-term path of inflation and interest rates. The current price is close to the Bollinger Band's middle line, suggesting the market is awaiting a new catalyst (such as the Federal Reserve's interest rate meeting). For the market, the stabilization of yields means that expectations of short-term liquidity tightening have not worsened further, but there are also no signs of easing.
5. Which commodity is likely to experience the greatest volatility in the next 2-3 days?
A: Crude oil volatility is expected to be the primary driver. As it is directly influenced by geopolitical directives, any rumors of interception operations or military conflict in the Strait of Hormuz could cause crude oil prices to gap down by several dollars. In contrast, the foreign exchange and gold markets, in the absence of major economic data, will likely remain in a technical consolidation and confirmation phase.
Crude oil: Geopolitical premiums and supply concerns under tariff rhetoric
The crude oil market is currently at a critical juncture of tug-of-war between bulls and bears. Fundamentally, recent tariff pronouncements and expectations of their implementation, along with directives to block shipping in specific regions, have significantly increased the geopolitical risk premium in the energy market. Leading institutions point out that the US's interception operations targeting specific "shadow fleets" and its directives to strike forces near the Strait of Hormuz have increased market concerns about potential crude oil supply disruptions. Although no substantial physical supply gap has yet materialized, the increased probability of such potential interception and confrontation has created a solid floor for oil prices.
From a technical perspective, the recent pullback in the main crude oil contract to the support range around $93 and $94 indicates strong buying interest. The chart shows a clear "double top" pattern, but catalyzed by geopolitical factors, the market is building momentum to break through the $100 mark. Logically, as long as the blockade and standoff in the relevant regions continue, the downside for oil prices will be limited. In the next 2-3 days, close attention should be paid to whether there are further military contacts in the relevant waters, as this will be the key variable determining whether oil prices can break through the $100 mark.
US Dollar and US Treasuries: Bullish Defense Amidst a Rebound Trend
The US dollar index recently rebounded after touching support at 97.62 and is currently hovering around 98.60. The 240-minute chart shows that the price has broken above the Bollinger Band's middle line and is attempting to break through the upper band at 98.95. The moving average system (MA1 and MA50) is in a bullish alignment, indicating a short-term bullish trend. Although the MACD indicator is running above the zero line, the red bars are narrowing slightly, suggesting a slight weakening of upward momentum, and the market is exhibiting caution before the strong resistance zone of 98.90 to 99.00.
Correspondingly, the 10-year US Treasury yield is fluctuating around 4.31%. Technically, the 4.34% to 4.35% range has formed a short-term double top resistance, and the MACD fast and slow lines are converging, indicating a temporary balance between bullish and bearish forces. Due to low consumer confidence and high inflation expectations, US Treasury yields are unlikely to fall significantly. In the next 2-3 days, the US dollar index is expected to maintain a slightly bullish trend between 98.20 and 99.00. If oil prices continue to rise, driving up inflation expectations, the dollar may test its previous high; otherwise, it may retrace to the strong support level around 98.25.
Spot gold: Technical pullback and support test
The price movement of spot gold has diverged somewhat from that of crude oil and the US dollar. After reaching a high of $4,899 in late March, gold prices are currently in a clear downward channel. Currently priced around $4,708, the price is trading below all moving averages, indicating an extremely bearish technical outlook. The MACD histogram continues to expand below the zero line, suggesting that selling pressure has not yet fully dissipated.
While the Russia-Ukraine situation and tensions in the Middle East provide a long-term safe-haven appeal for gold, its price is under significant pressure in the short term due to a stronger dollar and stabilizing US Treasury yields. The $4650 level is currently a key support zone in the short term; a break below this level could lead to further declines. Conversely, the $4750-$4800 range presents significant resistance. Logically, gold is currently in a phase of confluence between weakening safe-haven demand and technical correction, and is expected to consolidate or fluctuate weakly within the $4650-$4750 range over the next 2-3 days.
Future Outlook
In summary, the main theme of the market over the next 2-3 trading days will be "continued volatility driven by geopolitical conflicts." Crude oil prices, influenced by policy directives and interception actions, possess strong upward potential, and their movement will serve as a barometer of global risk appetite. The US dollar index, supported by a technical rebound and inflation expectations, will remain strong in the short term. Gold, however, needs to wait for signs of stabilization after the bearish momentum weakens. Overall market sentiment remains fragile, and investors must be highly vigilant about the instantaneous impact of sudden geopolitical news on asset prices. Until key levels such as 4.35% (US Treasury yield) and 99.00 (US dollar index) are effectively broken, the market will likely maintain its current range-bound trading pattern.
Frequently Asked Questions
1. Why has the price of gold been weak despite recent geopolitical tensions?
A: While the Russia-Ukraine situation and Middle East tensions have created safe-haven demand, the market's primary pricing logic is currently more influenced by the US dollar and real interest rates. The rebound in the US dollar index and the high levels of US Treasury yields have increased the opportunity cost of holding gold. Furthermore, after gold prices reached historical highs, there is significant profit-taking in the market, and technical correction pressures have masked some safe-haven buying, leading to a temporary weakness in gold prices.
2. What is the specific path of the impact of tariff rhetoric on crude oil prices?
A: Tariff rhetoric is often accompanied by tougher diplomatic and trade policies. In this round of volatility, it is directly reflected in the severe crackdown on energy exports from specific countries. By intercepting "shadow fleets" and monitoring key waterways, this policy expectation directly reduces market confidence in the stability of global crude oil supply, thereby incorporating the "risk premium" into oil prices and supporting crude oil prices above $93.
3. What challenges does the US dollar index face at the 99.00 level?
A: This level was a significant resistance point in the previous period. Currently, although technical indicators are bullish, the narrowing of the MACD histogram reflects some hesitation among bulls at higher levels. If today's University of Michigan consumer sentiment index falls short of expectations, it may reflect public concerns about the economic outlook under high inflation, thus limiting the dollar's further upward momentum in the short term.
4. What does the current trend in US Treasury yields indicate for ordinary investors?
A: The repeated fluctuations of the 10-year US Treasury yield around 4.30% indicate a divergence in market opinions regarding the long-term path of inflation and interest rates. The current price is close to the Bollinger Band's middle line, suggesting the market is awaiting a new catalyst (such as the Federal Reserve's interest rate meeting). For the market, the stabilization of yields means that expectations of short-term liquidity tightening have not worsened further, but there are also no signs of easing.
5. Which commodity is likely to experience the greatest volatility in the next 2-3 days?
A: Crude oil volatility is expected to be the primary driver. As it is directly influenced by geopolitical directives, any rumors of interception operations or military conflict in the Strait of Hormuz could cause crude oil prices to gap down by several dollars. In contrast, the foreign exchange and gold markets, in the absence of major economic data, will likely remain in a technical consolidation and confirmation phase.
- Risk Warning and Disclaimer
- The market involves risk, and trading may not be suitable for all investors. This article is for reference only and does not constitute personal investment advice, nor does it take into account certain users’ specific investment objectives, financial situation, or other needs. Any investment decisions made based on this information are at your own risk.