Soaring oil prices and a challenging interest rate outlook are weighing on gold's future direction, leaving the market uncertain.
2026-04-24 21:47:06
On Friday (April 23), during the European session, spot gold prices stabilized after a decline, with bullish funds entering the market to defend the key support level of $460, pushing prices up slightly. However, it's important to clarify that this stabilization is merely a short-term consolidation, not a signal of a trend reversal. The core negative factors that have been pressuring gold prices this week have not dissipated, and the technical charts have not shown any clear bullish reversal signals, leaving very limited room for a bullish counterattack. The following analysis will detail the current key price range and the substantial market changes needed to reverse the current bearish bias.

Gold prices were capped below the 50-day moving average.
From a daily chart perspective, spot gold saw a slight rebound on Friday, primarily due to traders actively supporting prices near the recent low of $4,640, temporarily halting the downward momentum. However, it's worth noting that this price level is both a crucial short-term support and a key dividing line between bullish and bearish sentiment. A decisive break below this level could trigger stop-loss orders, potentially leading to a faster decline in gold prices.
From a short-term technical perspective, the primary resistance level for gold prices is concentrated around the 50-day moving average, currently at $4870.42, which is a key indicator for assessing the strength of gold prices in the short term. Looking back at the market on April 17th, gold prices briefly tested this moving average resistance but failed to break through effectively. Subsequently, the market continued to exhibit a weak consolidation pattern of "lower highs and lower lows," fully reflecting the current strong selling sentiment, persistently weak buying demand, and the bears temporarily controlling the market.
In addition, gold prices are currently trading below the long-term key pivot level of $4744.34, indicating an overall weak trend. Looking at the price action, if selling pressure fails to ease effectively and the key support level of $4644.46 is breached, gold prices are likely to decline further. The next important support level will be the long-term Fibonacci retracement level of 61.8%, located at $4541.88, which is also a crucial defense level for the short-term market.
Oil prices have become the biggest negative factor suppressing gold prices.
This week, the international crude oil market experienced an explosive surge, with Brent crude spot prices rising by approximately 18% to firmly establish themselves above $105 per barrel, reaching a new high for the period. This sharp rise in oil prices was not accidental; the core trigger was the continued geopolitical tensions in the Strait of Hormuz. As a vital global oil transportation route, instability in the strait directly fueled market concerns about oil supply shortages, thus driving up oil prices. This trend also created a difficult-to-break upward ceiling for gold prices, a core connection often overlooked by most market participants.
From the perspective of market transmission logic, there is a clear negative correlation between rising oil prices and gold prices: the continued rise in oil prices will directly drive up global inflation, and the increased inflationary pressure will force the Federal Reserve to maintain its current high interest rate policy and will not start a rate-cutting cycle in the short term; the Federal Reserve's maintenance of high interest rates will further support the strength of the US dollar index, while attracting global funds to continue flowing into dollar assets and various high-yield bonds; as a non-interest-bearing asset, gold will be suppressed by the strong dollar and lack upward momentum due to capital outflows, ultimately falling into a dilemma of being pressured from both sides, and its market performance will continue to be limited.
It's important to clarify that one of gold's core traditional attributes is that of an "inflation hedge," meaning that when market inflation rises, investors hold gold to protect against the risk of asset devaluation caused by inflation. However, this safe-haven logic only works if the market is in a rate-cutting cycle, or if there is a widespread expectation of a future rate-cutting cycle. The current market environment is the opposite: interest rates in major global economies remain high with no expectation of easing, and high oil prices above $100 further solidify the high-inflation environment, making gold's inflation-hedging attribute difficult to function. At the same time, the yield on 10-year US Treasury bonds continues to climb, and the US dollar index is steadily strengthening. These two factors combined, even with continued global geopolitical tensions, are enough to limit any rebound in gold prices, becoming the core force suppressing gold prices.
The failed upward breakout has clearly signaled a market reversal.
The gold market experienced a crucial turning point – gold prices briefly tested the key resistance level of the 50-day moving average and nearly broke through, but ultimately failed to hold, subsequently falling back quickly after the initial surge. This movement was not accidental, but rather a core signal of a market reversal: in financial markets, when an asset price faces a key resistance level and stalls, it often signifies that market buying power has been exhausted. Previously lurking short positions will seize the opportunity to enter the market and drive down prices, while existing long positions will choose to take profits or cut losses and exit the market.
It was under this market logic that gold ended its four-week winning streak, marking its first weekly decline in nearly five weeks. This failed upward move not only completely reversed the market's bullish momentum but also turned market sentiment cautious. As of now, there are no signs of a recovery in the bullish momentum, and the short-term market is expected to remain weak and consolidating.
The only bullish logic worth paying attention to
Despite the prevailing negative factors in the current gold market, there is still a bullish factor worth noting for investors: the continued recovery in physical gold demand from India and China, the two largest gold-consuming countries. Driven by seasonal peak consumption and the recovery in market demand, both countries have seen a significant increase in physical gold purchases recently. Simultaneously, due to tight global gold supply, the gold spot premium in the Indian market is narrowing, a phenomenon that fully reflects the current robust demand in the physical gold market.
It is important to emphasize that physical gold demand is highly inelastic and will not quickly diminish due to rising US Treasury yields or a stronger dollar. Instead, it can provide some support for gold prices, preventing excessive declines. However, in the current market, physical buying remains limited and has not yet generated sufficient strength to offset the systemic negative pressure from high interest rates and a strong dollar. Therefore, it is unlikely that the weak trend in gold will change in the short term.
Core Trading Ideas and Outlook
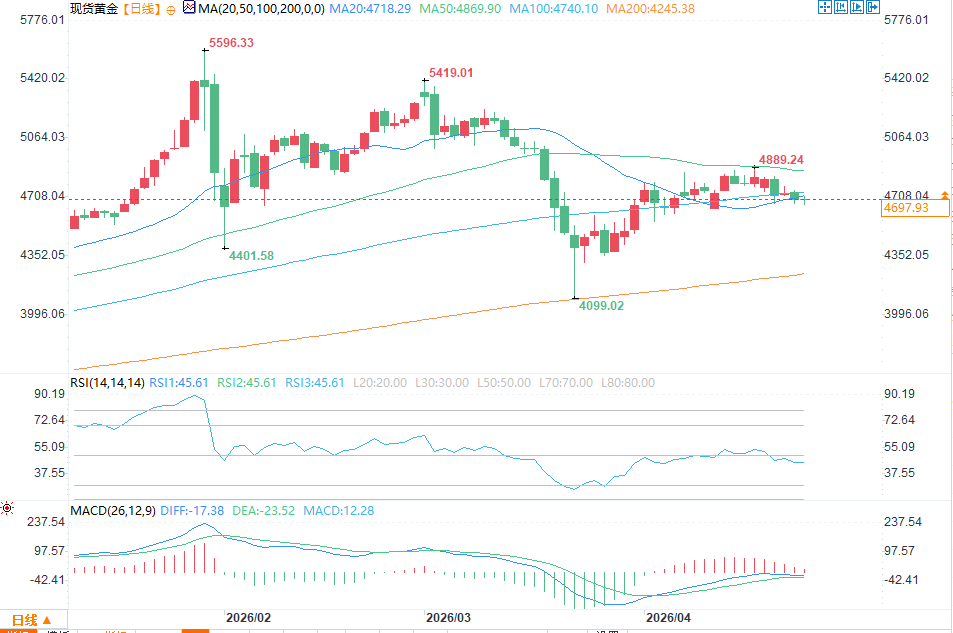
(Spot gold daily chart source: FX678)
Considering the current market environment and technical trends, it is not recommended for investors to chase gold prices higher at this stage, to avoid being trapped in a passive loss. The most reasonable trading strategy at present is to wait patiently for the price of gold to fall back to the core value range of $4495.33-$4401.84, closely observe the strength of buying support at lower levels, and then consider placing long orders.
In the long term, the 200-day moving average of $4,245.95 is the core anchor point for the long-term trend of gold. As long as this long-term support level is not effectively broken, the overall upward structure of gold will not be destroyed, and the "buy on dips" trading strategy will still hold true.
Gold prices were capped below the 50-day moving average.
From a daily chart perspective, spot gold saw a slight rebound on Friday, primarily due to traders actively supporting prices near the recent low of $4,640, temporarily halting the downward momentum. However, it's worth noting that this price level is both a crucial short-term support and a key dividing line between bullish and bearish sentiment. A decisive break below this level could trigger stop-loss orders, potentially leading to a faster decline in gold prices.
From a short-term technical perspective, the primary resistance level for gold prices is concentrated around the 50-day moving average, currently at $4870.42, which is a key indicator for assessing the strength of gold prices in the short term. Looking back at the market on April 17th, gold prices briefly tested this moving average resistance but failed to break through effectively. Subsequently, the market continued to exhibit a weak consolidation pattern of "lower highs and lower lows," fully reflecting the current strong selling sentiment, persistently weak buying demand, and the bears temporarily controlling the market.
In addition, gold prices are currently trading below the long-term key pivot level of $4744.34, indicating an overall weak trend. Looking at the price action, if selling pressure fails to ease effectively and the key support level of $4644.46 is breached, gold prices are likely to decline further. The next important support level will be the long-term Fibonacci retracement level of 61.8%, located at $4541.88, which is also a crucial defense level for the short-term market.
Oil prices have become the biggest negative factor suppressing gold prices.
This week, the international crude oil market experienced an explosive surge, with Brent crude spot prices rising by approximately 18% to firmly establish themselves above $105 per barrel, reaching a new high for the period. This sharp rise in oil prices was not accidental; the core trigger was the continued geopolitical tensions in the Strait of Hormuz. As a vital global oil transportation route, instability in the strait directly fueled market concerns about oil supply shortages, thus driving up oil prices. This trend also created a difficult-to-break upward ceiling for gold prices, a core connection often overlooked by most market participants.
From the perspective of market transmission logic, there is a clear negative correlation between rising oil prices and gold prices: the continued rise in oil prices will directly drive up global inflation, and the increased inflationary pressure will force the Federal Reserve to maintain its current high interest rate policy and will not start a rate-cutting cycle in the short term; the Federal Reserve's maintenance of high interest rates will further support the strength of the US dollar index, while attracting global funds to continue flowing into dollar assets and various high-yield bonds; as a non-interest-bearing asset, gold will be suppressed by the strong dollar and lack upward momentum due to capital outflows, ultimately falling into a dilemma of being pressured from both sides, and its market performance will continue to be limited.
It's important to clarify that one of gold's core traditional attributes is that of an "inflation hedge," meaning that when market inflation rises, investors hold gold to protect against the risk of asset devaluation caused by inflation. However, this safe-haven logic only works if the market is in a rate-cutting cycle, or if there is a widespread expectation of a future rate-cutting cycle. The current market environment is the opposite: interest rates in major global economies remain high with no expectation of easing, and high oil prices above $100 further solidify the high-inflation environment, making gold's inflation-hedging attribute difficult to function. At the same time, the yield on 10-year US Treasury bonds continues to climb, and the US dollar index is steadily strengthening. These two factors combined, even with continued global geopolitical tensions, are enough to limit any rebound in gold prices, becoming the core force suppressing gold prices.
The failed upward breakout has clearly signaled a market reversal.
The gold market experienced a crucial turning point – gold prices briefly tested the key resistance level of the 50-day moving average and nearly broke through, but ultimately failed to hold, subsequently falling back quickly after the initial surge. This movement was not accidental, but rather a core signal of a market reversal: in financial markets, when an asset price faces a key resistance level and stalls, it often signifies that market buying power has been exhausted. Previously lurking short positions will seize the opportunity to enter the market and drive down prices, while existing long positions will choose to take profits or cut losses and exit the market.
It was under this market logic that gold ended its four-week winning streak, marking its first weekly decline in nearly five weeks. This failed upward move not only completely reversed the market's bullish momentum but also turned market sentiment cautious. As of now, there are no signs of a recovery in the bullish momentum, and the short-term market is expected to remain weak and consolidating.
The only bullish logic worth paying attention to
Despite the prevailing negative factors in the current gold market, there is still a bullish factor worth noting for investors: the continued recovery in physical gold demand from India and China, the two largest gold-consuming countries. Driven by seasonal peak consumption and the recovery in market demand, both countries have seen a significant increase in physical gold purchases recently. Simultaneously, due to tight global gold supply, the gold spot premium in the Indian market is narrowing, a phenomenon that fully reflects the current robust demand in the physical gold market.
It is important to emphasize that physical gold demand is highly inelastic and will not quickly diminish due to rising US Treasury yields or a stronger dollar. Instead, it can provide some support for gold prices, preventing excessive declines. However, in the current market, physical buying remains limited and has not yet generated sufficient strength to offset the systemic negative pressure from high interest rates and a strong dollar. Therefore, it is unlikely that the weak trend in gold will change in the short term.
Core Trading Ideas and Outlook
(Spot gold daily chart source: FX678)
Considering the current market environment and technical trends, it is not recommended for investors to chase gold prices higher at this stage, to avoid being trapped in a passive loss. The most reasonable trading strategy at present is to wait patiently for the price of gold to fall back to the core value range of $4495.33-$4401.84, closely observe the strength of buying support at lower levels, and then consider placing long orders.
In the long term, the 200-day moving average of $4,245.95 is the core anchor point for the long-term trend of gold. As long as this long-term support level is not effectively broken, the overall upward structure of gold will not be destroyed, and the "buy on dips" trading strategy will still hold true.
- Risk Warning and Disclaimer
- The market involves risk, and trading may not be suitable for all investors. This article is for reference only and does not constitute personal investment advice, nor does it take into account certain users’ specific investment objectives, financial situation, or other needs. Any investment decisions made based on this information are at your own risk.